How to stay at front of F1's DRS train — why Alex Albon aced Canadian GP

F1

Alex Albon delivered a stunning drive to secure seventh for Williams in Canada – Project F1 analyses how he did it

Alex Albon in 2023 Canadian Grand Prix

Albon held on to qualifying gains by keeping rivals behind him

Williams

The 2023 Canadian GP saw one of the drives of the season so far, as Alex Albon made his hard tyres last an incredible 58 laps, clinging on to seventh ahead of a four-car train – with each competitor having DRS and the benefit of fresher tyres.

The Williams driver excelled in three key areas to make this happen, first putting in a scintillating qualifying session to secure ninth on the grid.

He was then able to manage his tyre wear brilliantly, while his rivals were forced to pit, giving Albon track position.

He then used the car’s characteristics to maintain his position ahead of a car which was technically faster – the Alpine of Esteban Ocon – and secure Williams‘ best finish of the season.

Below, we analyse all three key areas, digging into just how Albon put in such a virtuoso performance, and also illustrating how the DRS train operates, with one car able to keep a line of DRS-enabled rivals behind.


Canadian GP qualifying


Albon’s perfect timing

Chart 1 Qualifying grip conditions

The animated chart, above, illustrates the changeable conditions during Q2 by showing which tyre was used to set the fastest time in each sector as the session went on.

It was an opportunity for Williams, which knew that a strong qualifying result could deliver points on race day.

Related article

The team’s 2023 design philosophy has centred around having a ‘slippery’ car — that’s very fast in a straight line relative to its competitors. Unlike the Red Bull – another car with superior top speed – the Williams lacks aerodynamic efficiency, meaning it struggles for pace through corners.

As such, circuits that require varied performance windows prove challenging for the Grove machines, but Montreal doesn’t fall into this category. It’s essentially made up of two long straights, punctuated by chicanes and slow hairpins, playing to the Williams’ straight-line strengths.

For the team to take advantage of this, a good qualifying spot was crucial. On a drying track, with rain on its way, Albon’s brilliance behind the wheel came into play. The Williams driver was first to switch to soft slicks in Q2. As Chart 1 shows, they began to outperform the intermediates at certain parts of the track.

Albon had a few laps to find grip while building tyre temperature. This placed him in the perfect window to set a hot lap for when the soft tyre suddenly became overwhelmingly faster than the intermediates – his Q2-topping time was 0.6sec faster than anyone else.

As illustrated, not long after the conditions then started to turn back towards the intermediates.


Narrow window for soft tyres

Chart 2 Q2 lap times by tyre compound

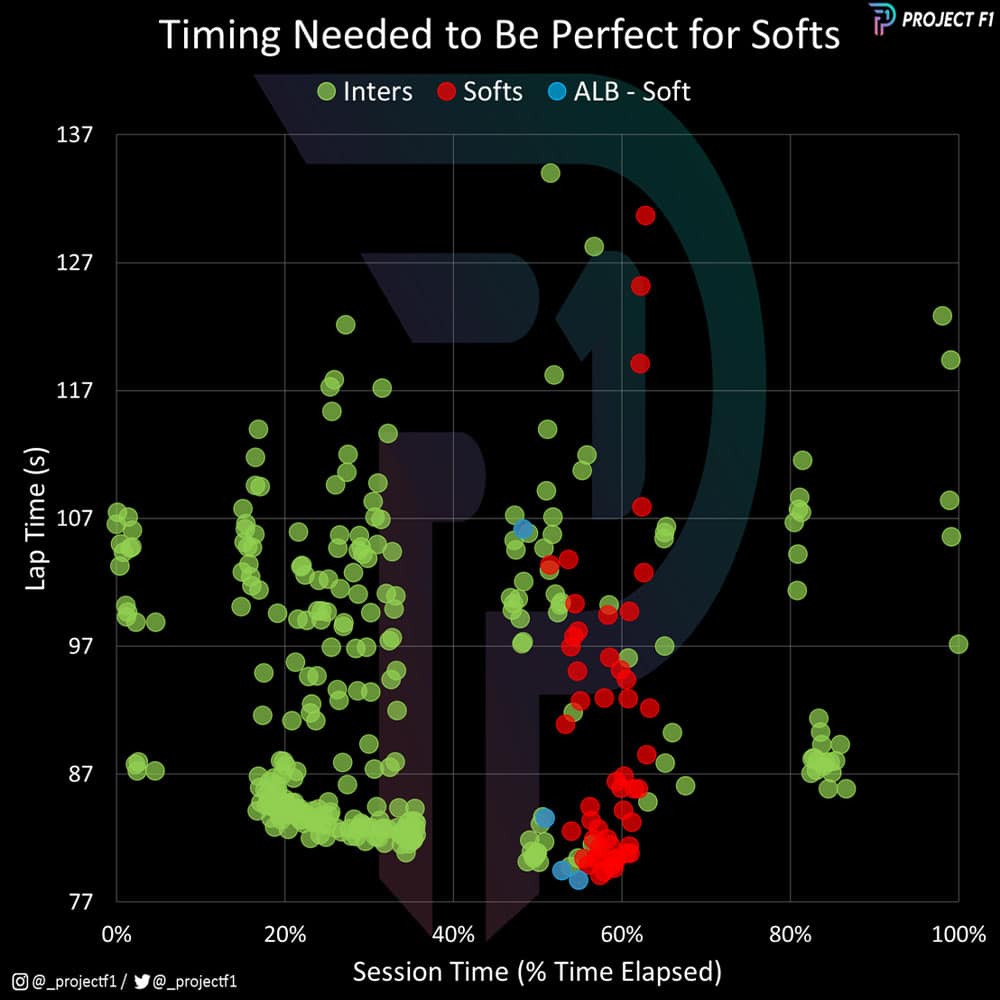
No-one was able to maximise the opportunity to use their slick tyres quite like Albon did. Chart 2 plots each driver’s lap times throughout the session, based on the tyre they were running. Albon’s slick-tyred laps are shown in blue, with other drivers’ soft-tyred times in red, and intermediate laps in green.

As soon as the Williams driver set his 1min 18.725sec Q2 hot lap (the fastest lap of the qualifying session) the track conditions started to deteriorate as shown by the upward trend in the red dots.

Not even Verstappen, with all the might of the Red Bull, could match Albon’s performance. This put Albon through to Q3, where he bagged an eventual starting slot of P9 for the race.


Canadian GP race


Tyre life key to Williams strategy

Chart 3 Tyre strategies

Ekagra Canada 23 C3

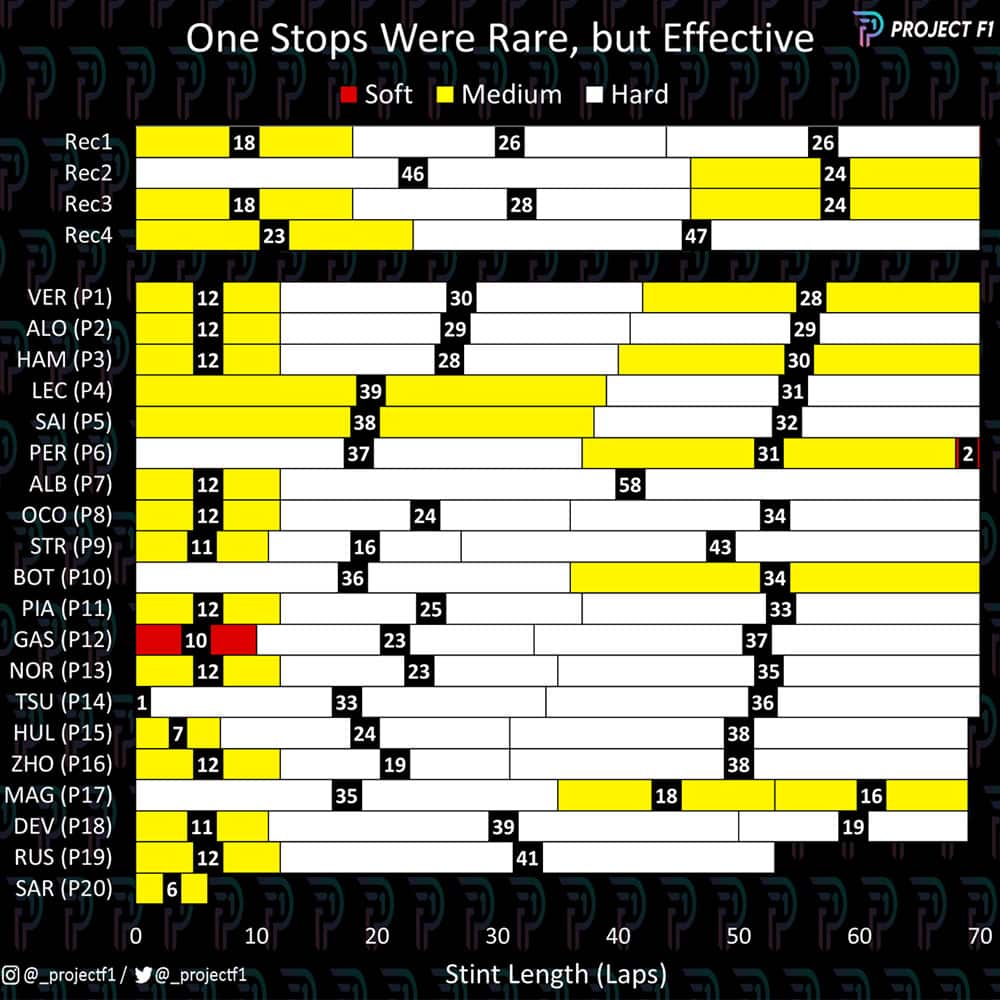
The potential for Williams to then score points in the race mainly revolved successfully executing a one-stop strategy and maintaining track position.

As Chart 3 shows, with the tyre strategies for each driver, underneath the four recommended by Pirelli, this is exactly what Albon did.

When George Russell hit the wall on lap 12, several drivers took the opportunity to come in for tyres under the safety car. Going for a one-stop from lap 12 was aggressive even by Pirelli’s estimations, but Albon managed to look after his tyres for 58 laps and make it work. No other driver on a successful one-stop strategy stopped anything like as early.


One-stop saves Albon from DRS train

Chart 4 Cumulative delta plot

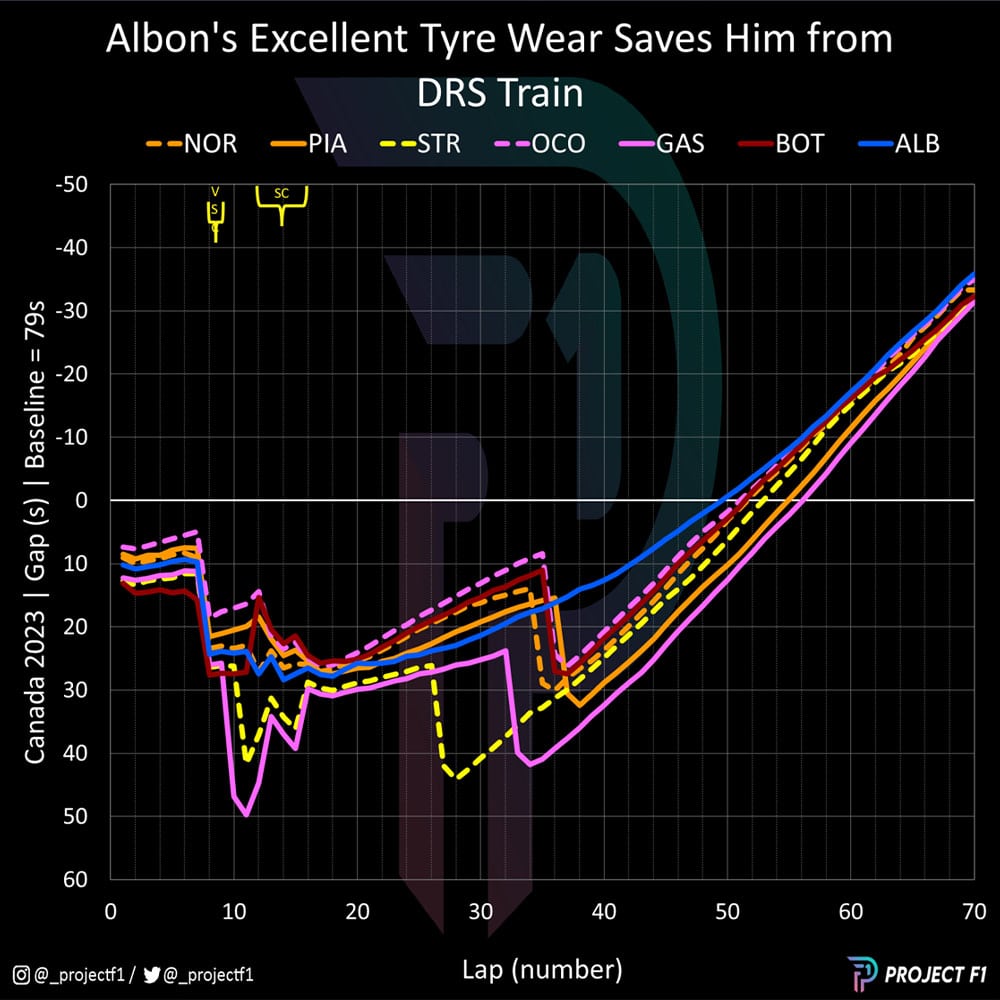
Just how successful Albon’s one-stop approach was is reiterated in Chart 4. The cumulative delta plots each driver’s average lap time, updated for every lap of the race, and set against an average 1min 19sec lap time.

After losing out in a battle for position with Piastri in the laps following the safety car restart, Albon’s race began to find a rhythm.

Taking a close look at laps 34-36 shows that Albon began closing in on Piastri again, with the Williams faring well in traffic. Piastri then pitted, as did the likes of Ocon, Bottas and Norris, gifting Albon clean air and allowing him to put some distance between himself and his peers.


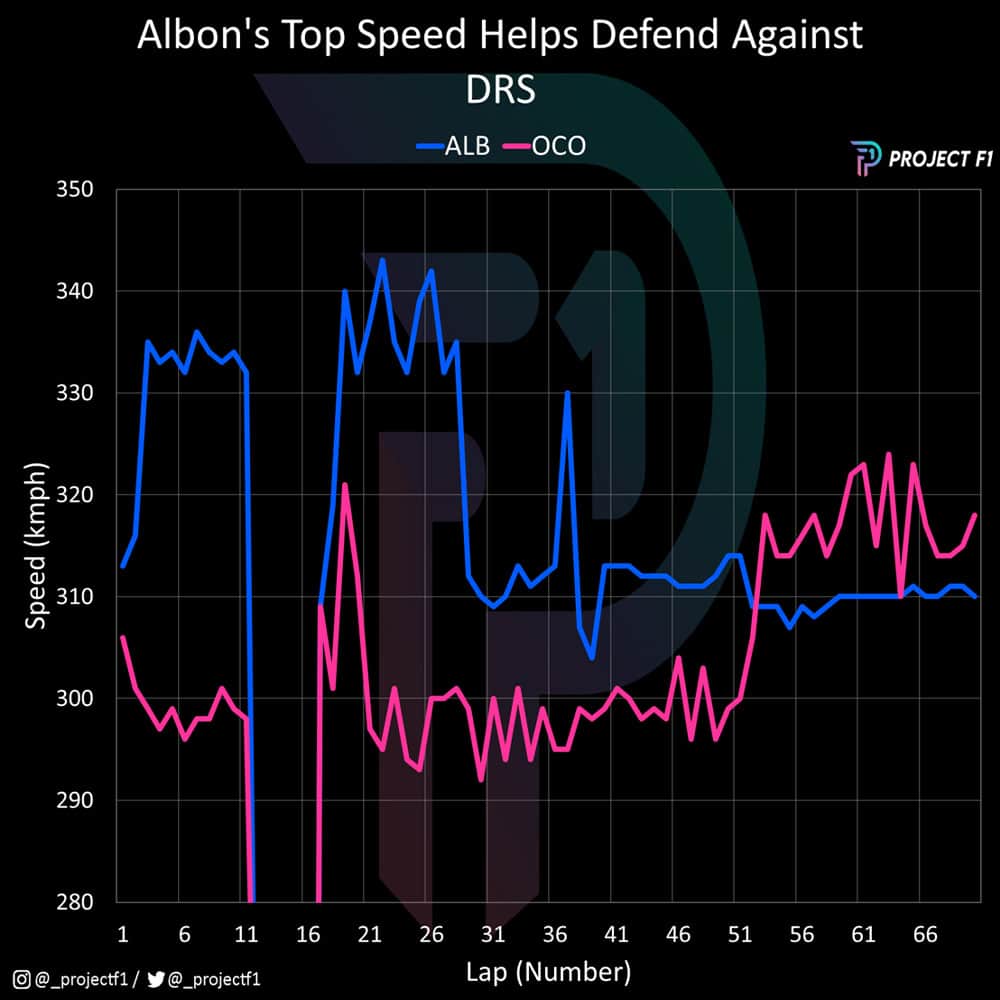
Albon keeps Ocon at bay

Chart 5 Trend race pace

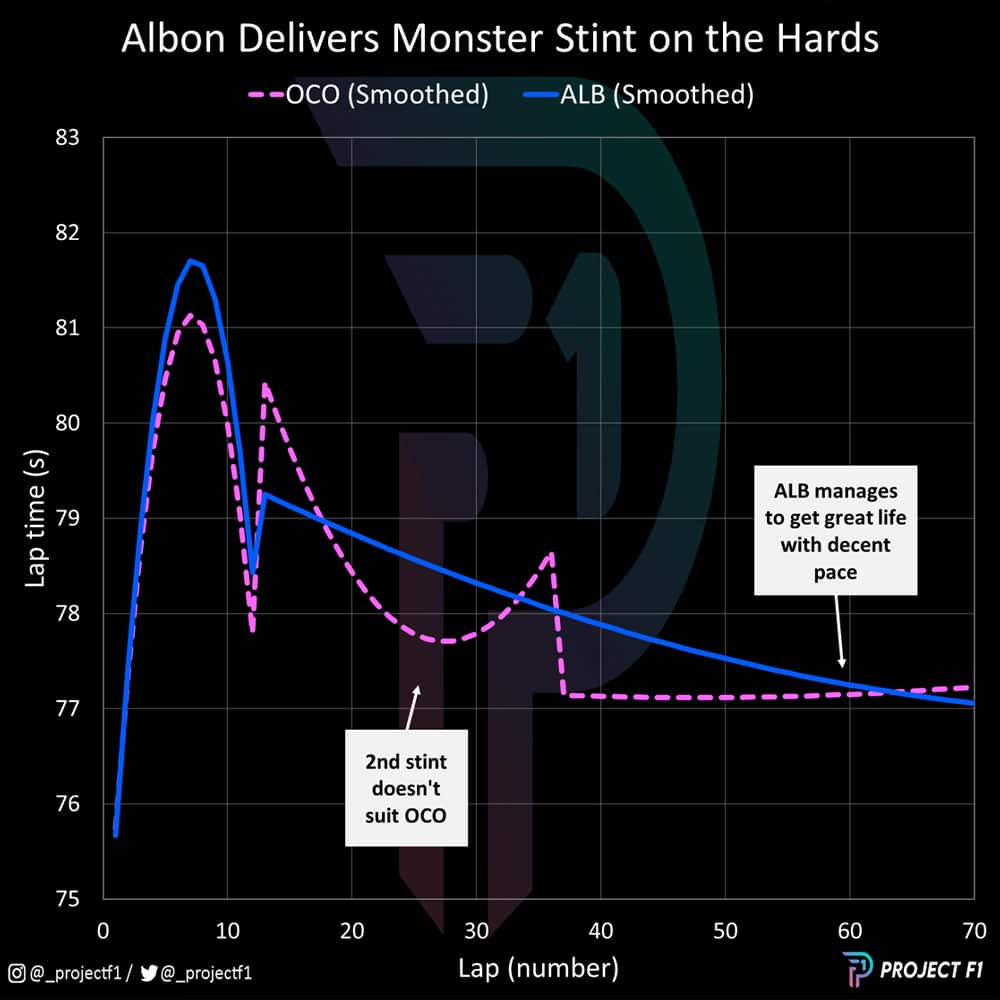
Chart 5 above provides some extra analysis on the pace differential between Albon and Ocon; the Alpine behind the Williams from lap 54 to the end of the race on lap 70.

Related article

While Ocon had stronger pace in the earlier parts of the second stint, it was short-lived. The pace started to fall away from lap 30 onwards, a contrast to Albon whose slow and steady approach was starting to pay dividends.

When the Alpine pitted again, fresh tyres should have handed the advantage back to Ocon. But instead of Ocon’s pace improving, it stagnated and then converged with Albon’s (even falling behind in the very closing stages of the race).

So how was the Williams able to hold onto position on old tyres with the threat of DRS from the Alpine?


The right car for the right track

Chart 6 Top speed vs average speed

Canadian GP top speed and average speed ratio

We have already alluded to the dynamics of the Williams car philosophy. Chart 6 above shows the relationship between top speed and average speed. The goal of any car is to try and place in the top right corner.

Related article

This implies that your car can achieve high top speed with little sacrifice to average speed across a lap. It indicates aerodynamic efficiency as you can maintain a high top speed while also having high cornering speed (and thus a high average speed). High top speed with inefficient aero would mean low downforce levels negatively impacting on cornering performance.

As it turns out, Albon has the best top speed out of anyone with the added benefit of maintaining a strong average speed. This means the car had good balance – especially compared to Ocon. This goes a long way into explaining why Ocon’s pace converged to Albon (the car in front) as shown in Chart 5 and why Ocon couldn’t overtake as shown in Chart 4.

It’s worth noting that the frontrunners have the best average pace but poorer top speed due to lesser usage of DRS. This is also why Sainz has better top speed, despite finishing very close to Leclerc.


Top speed defeats DRS

Chart 7 Speed trap performance

Chart 7 above shows the detail that can be lost when summarising average speeds. Albon had very strong top speed performance in the speed traps in the first 30 laps of the race. This is partly due to the car, slipstream effects and DRS. This is contrast to Ocon who had lower speeds but was also lapping in clean air during this time.

This dynamic reverses from lap 50 onwards, with Albon now in clean air and Ocon with slipstream and DRS. And while Ocon is faster, the magnitude of his advantage is not a mirror image. In other words, Albon’s raw top speed is so strong that he can partially offset the threat of Ocon with DRS.

Albon’ solid tyre management also meant that his exit speeds out of the hairpin were not compromised, meaning that even with such a long second stint, he could still lay down the necessary traction to build competitive top speed relative to Ocon. These crucial elements are what helped Albon cement himself as best of the rest and earn the ‘Driver of the Day’ award in Canada.


Project F1 turns data into graphics that uncover race pace and strategy
See more analysis at @_ProjectF1 on Twitter or @_ProjectF1 on Instagram