MPH: Pre-season test times are a mug's game — but not meaningless

F1

Pre-season testing will give us an idea of this year's F1 podium contenders, says Mark Hughes. But don't read too much into it...

Toro Rosso pre-season testing

Motorsport Images

It comes that time of year when we get the first slivers of information about the competitive shape of the season ahead, where we sift through the lap times from a chilly Barcelona trying to see the patterns. It’s a mug’s game ultimately, of course, in that it cannot reveal a definitive, true, real picture. But it invariably by the end of the second week, we are much better informed than we are right now.

So ahead of the analysis of those two tests – which this year are just three days each rather than the previous four – let’s look at exactly what these apparently random sequences of laps can tell us.


Forget headline numbers

There will invariably be a list each day and at the end of the test that simply arranges the cars in actual lap time order. It means next to nothing in that there are different tyre compounds, fuel loads, engine modes and track conditions when each time was set. In actual performance, a mid-grid car will tend to be around 1sec slower than the fastest – but a mid-grid team could easily find more than 1sec by running a softer tyre at a more advantageous time of day and on a different programme. With a combination of a favourable fuel load, tyre and track conditions, it could find twice that… So the list, in isolation, means nothing.


‘Sandbagging’ is a myth

Leclerc pit board in Barcelona testing 2019

Ferrari topped the tables in testing last year by running at full potential for several days. Others didn’t…

Motorsport Images

The disconnect between the actual competitive order and that suggested by the headline numbers often leads to the simplistic assumption of the top teams ‘sandbagging’, ie deliberately choosing not to reveal their true performance. It doesn’t happen like that. Not in the modern day, test day-restricted F1, at any rate. The reality is that each team will have its own unique run plan for each day and no two run plans will be identical; they are all investigating their cars in a slightly different way, with different priorities. It is this which leads to the disconnect between reality and headline numbers, not some bizarre second-guessing game theory indulged in by devious engineers with no obvious advantage. Every team is flat-out getting as much performance on their cars as possible on the run-up to the first race. It isn’t as if they could suddenly just try a bit harder if only they’d realised the Mercedes was running with 50kg of fuel all long…

But what about last year, you may say? When Mercedes didn’t look as fast as Ferrari in testing – then qualified on pole in Melbourne 0.6sec faster than anyone else.

Related article

2020 F1 car launches: dates and news
F1

2020 F1 car launches: dates and news

It's launch week for Formula 1, as the covers start to come off the 2020 challengers. Teams will be be looking to maximise their performance under the current rules, while…

By Motor Sport

Last year, Mercedes only brought its pukka 2019 car to the second week of testing, using just a basic aero package in the first week. This wasn’t some plan to throw the opposition off some supposed scent. It was done to give the aero department more time to find raw performance in the tunnel without the time pressure of readying the car for the first week of the test. In a year when there was a steep learning curve because of the new aero regs, this made perfect sense and Mercedes had the resource to do it. It had deployed exactly the same strategy in 2017, with the new wide body regs. For this year, Mercedes says it will not be doing that, that the stability of the regs mean the development curve in the tunnel is nowhere near as steep.

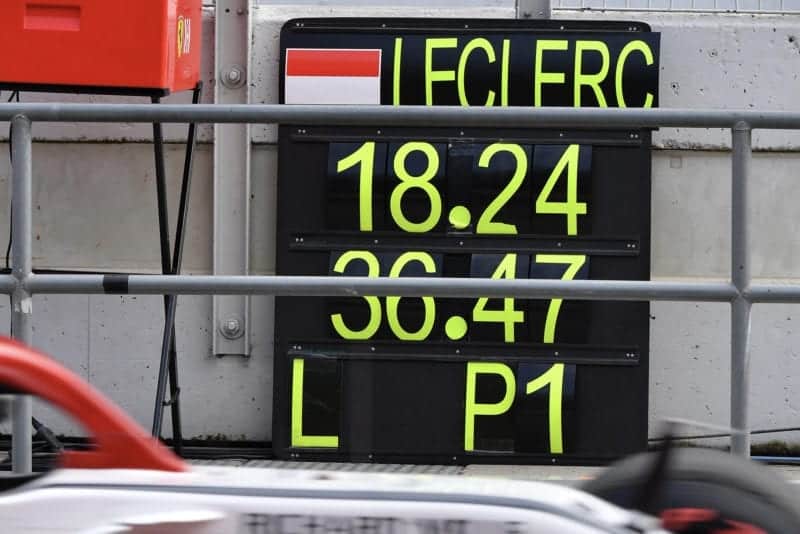
So in the second week of testing last year, Mercedes spent the first few days doing the usual verification and fine tuning runs. It was only in the last day-and-a-half that we even saw a representative Mercedes pace – whereas the Ferrari had been running close to its full potential for many days by then. Even so, the best Mercedes lap was within hundredths of Ferrari’s best despite having only just got started on performance testing. Couple that with a Ferrari engine problem in Melbourne and a track layout that revealed its front-end aero shortfall in a way Barcelona didn’t, and suddenly Ferrari was 0.6sec off Mercedes. But there was no sandbagging involved. Mercedes hadn’t deliberately sacrificed four days of learning and relevant running just to give a misleading picture to the opposition which then took its foot off the gas and took no further interest in finding more performance. That’s a cartoon version of F1, not the reality.

Valtteri Bottas in 2019 pre-season F1 testing

Mercedes left it late last year to show a representative time

Motorsport Images


How do we know fuel loads?

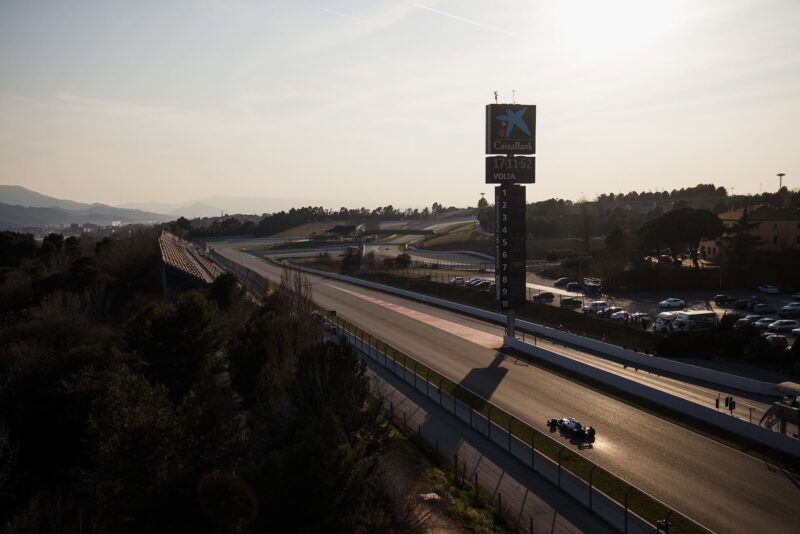
We don’t. But we can easily infer them on a long run. In theory the cars will be built with a tank big enough to house the regulation 110kg maximum of fuel. The grand prix at Barcelona is held over 66 laps. If they ran flat-out the whole race – which they can’t – that would work out at 1.67kg per lap. In reality the reduced pace imposed by tyre degradation and the short-fuelling practices the teams use in anticipation of that means they will use more like 100kg, which makes the average usage around 1.5kg per lap.

If a car does a stint in testing of, say, 20 laps, it may have done that as part of a race simulation, maybe the first stint of a two-stop simulation, maybe the second or the third stint. Obviously there would be a different fuel load for each. But the very least we know is that the car had at least 20-laps-worth of fuel in it – because it actually did 20 consecutive laps. So it therefore had, at the very minimum, 30kg of fuel in it at the start of the run.

We know, with a fair degree of accuracy, the amount of lap time that weight costs on any given track. At Barcelona, each 10kg of weight costs around 0.35sec. So in the case of the 20-lap stint example above, at the beginning of the run the car will have at least 1.05sec-worth of weight penalty (0.35sec x 3 lots of 10kg). For each lap it does in that 20-lap stint we can know its fuel weight relative to the beginning of the stint and so have a theoretical weight penalty for each lap. We can thus weight-correct each lap. We know that the car could do at least that weight-corrected time if it was fuelled only for a qualifying lap. For example:

Actual Weight-corrected to 30kg start
Lap 1 1min 20.0sec 1min 18.95sec
Lap 2 1min 19.8sec 1min 18.47sec
Lap 3 1min 19.8sec 1min 18.785sec
etc

Of course it could be that the car was fuelled for 66 laps when it did that 20-lap run (if it was a replication of the first race stint) or for, say, 40 laps. These will represent huge differences in performances. A car fully fuelled up will be around 2.3sec per lap slower than its single-lap potential, even disregarding engine modes and tyres.

This is where we have to use the fast low-fuel run time as a rough guide. We will know which tyre compound was fitted when any given car did its fastest time. If on a 20-lap run the car is initially running around 2sec slower than that, it’s quite possibly fully fuelled. If it’s running around 1sec slower than its best, it’s probably half-fuelled. It’s only order of magnitude, but in combination with the run patterns (the actual race simulations will be very obvious in their sequences) it gives a realistic idea. When there are lots of such runs (short ones and long) for all of the cars, the picture becomes clearer still.


What about tyres?

Pirelli tyres at 2019 pre-season F1 testing

Pirelli can give fairly accurate estimates of the difference in single lap time potential between each of their compounds. The compounds (unless they are experimental) will still be denoted by the colour of the sidewall stripes. So we know which tyres are on which car when. So for the single-lap pace we can correct to a control compound (usually the fastest one). So if a Mercedes laps in 1min 16.5sec on mediums but the Red Bull is on softs when it records a 1min 16.0sec – and Pirelli tell us the difference in performance between soft and medium is 0.7sec, then we can say that in this comparison the Merc’s appeared to be a better time by around 0.2sec. It’s not definitive (different cars react differently to the compounds), but it’s a guide.

But the performance of the tyres degrade – and at different rates. This becomes important in the long runs. Going back to that 20-lap run, we can have our weight-corrected lap time for each of those 20 laps. We can compare each of those weight-corrected laps to the best (theoretical or actual) time the car has done – and we will tend to see an increasing deficit to that ideal through the stint. This will be the tyre degradation. Each car’s will be different and we can often see some very interesting patterns emerge from that analysis.

There are many other complicating factors too. Which cars were running DRS and which weren’t, for example? How much slower was the track in the afternoon than the morning (a common Barcelona phenomenon)? Was each tyre compound able to reach its critical temperature threshold on a track around 30C cooler than it will be come May? But it’s in the patterns of repetition that we can get our best soundings of the competitive order.

It’s far from complete and until we get to Melbourne it’s all we have to go on. But it is a very long way from meaningless.