Race data shows staggering scale of Verstappen's Belgian GP win

F1

Max Verstappen was clearly a league apart in the 2022 Belgian Grand Prix. Examining the data shows just how much faster he was than rivals — and how the effect was multiplied by their various issues

Max Verstappen at Eau Rouge in the 2022 Belgian Grand Prix

Antonin Vincent / DPPI

The scene was set for a thriller: Max Verstappen starting just ahead of Charles Leclerc, near the back of the grid, while Sergio Perez and Carlos Sainz sat on the front row, with both Mercedes and Fernando Alonso breathing down their necks.

It could have been a battle royal but by lap 12 of the Belgian Grand Prix, Verstappen had already hit the front, on his way to leaving the competition in his dust.

The Dutchman’s race appeared to be one of perfection and the data suggests little else. Examining the his pace shows the staggering margin that he had over the rest.

It also helps illustrate why nobody could challenge him, as blocked brake ducts and tyre degradation hampered some rivals, while Sergio Perez continues to struggle with the latest-spec Red Bull.

The Belgian GP story

Chart 1 Cumulative delta plot

Belgian GP chart 1

The chaos of the start, and its effect on the race is captured in the chart above, which plots the average lap time of each driver — updated for each lap of the race — against a 1min 44sec baseline lap.

Perez pointed his Red Bull towards polesitter Sainz on the grid, ready to fight for the lead, but was caught out by the fast-starting duo of Hamilton and Alonso.

Related article

As a result, his slewing car was compromised into Turn 1 and he ceded position, leaving Sainz unchallenged at the front, just when the Red Bull’s straightline speed advantage could have been put to great effect.

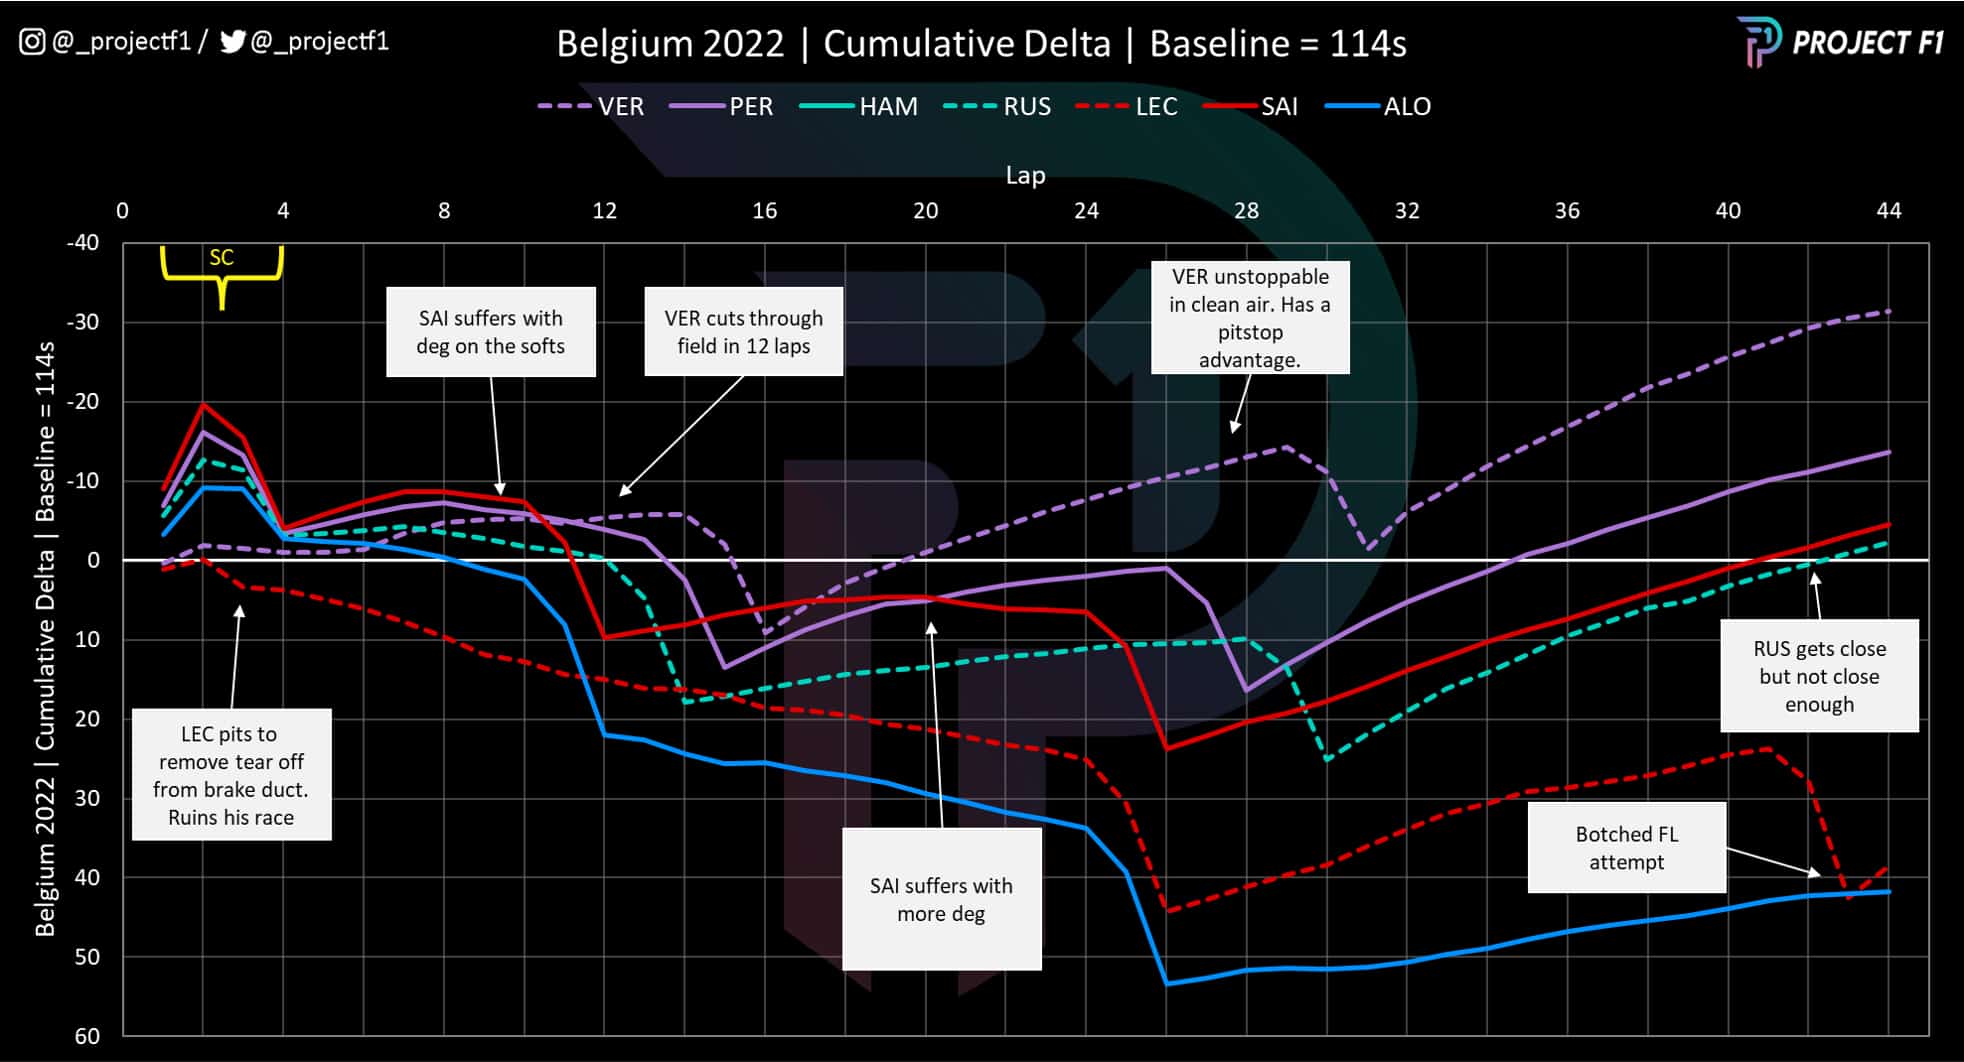
The loss was temporary, however, as Perez moved back up the order, thanks to the clash between Hamilton and Alonso. The graph shows the frontrunners already pulling out a large gap to Leclerc and Verstappen, even though the championship leader was already up to eighth.

Then came the safety car to reset the race and compress the field. It’s clear how Verstappen moves back into contact with the leaders.

Leclerc’s hopes follow the path of the dotted red line, which dips as he makes a pitstop after a rogue tear-off strip (Verstappen’s no less), became trapped in his brake duct. He’s now in a totally different race to the rest.

The restart

Sainz holds on to his lead from Perez but his pace quickly slows and average lap time drops, as his soft tyres wear faster than expected. In contrast, Verstappen’s average race pace just keeps getting quicker, as he cuts through the field and hits the front on lap 12 after Sainz pits. He would have led a lap sooner if Perez had allowed him through immediately.

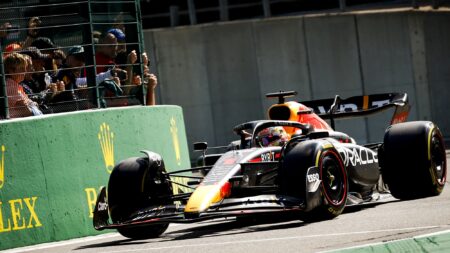
From here on, Verstappen was in clean air and able to unleash his true pace. He pitted, then passed Sainz on lap 18 and galloped away from the rest of the field so much so that he had a pitstop gap back to his team-mate, as shown above. A truly dominant performance to take victory in the Belgian Grand Prix.

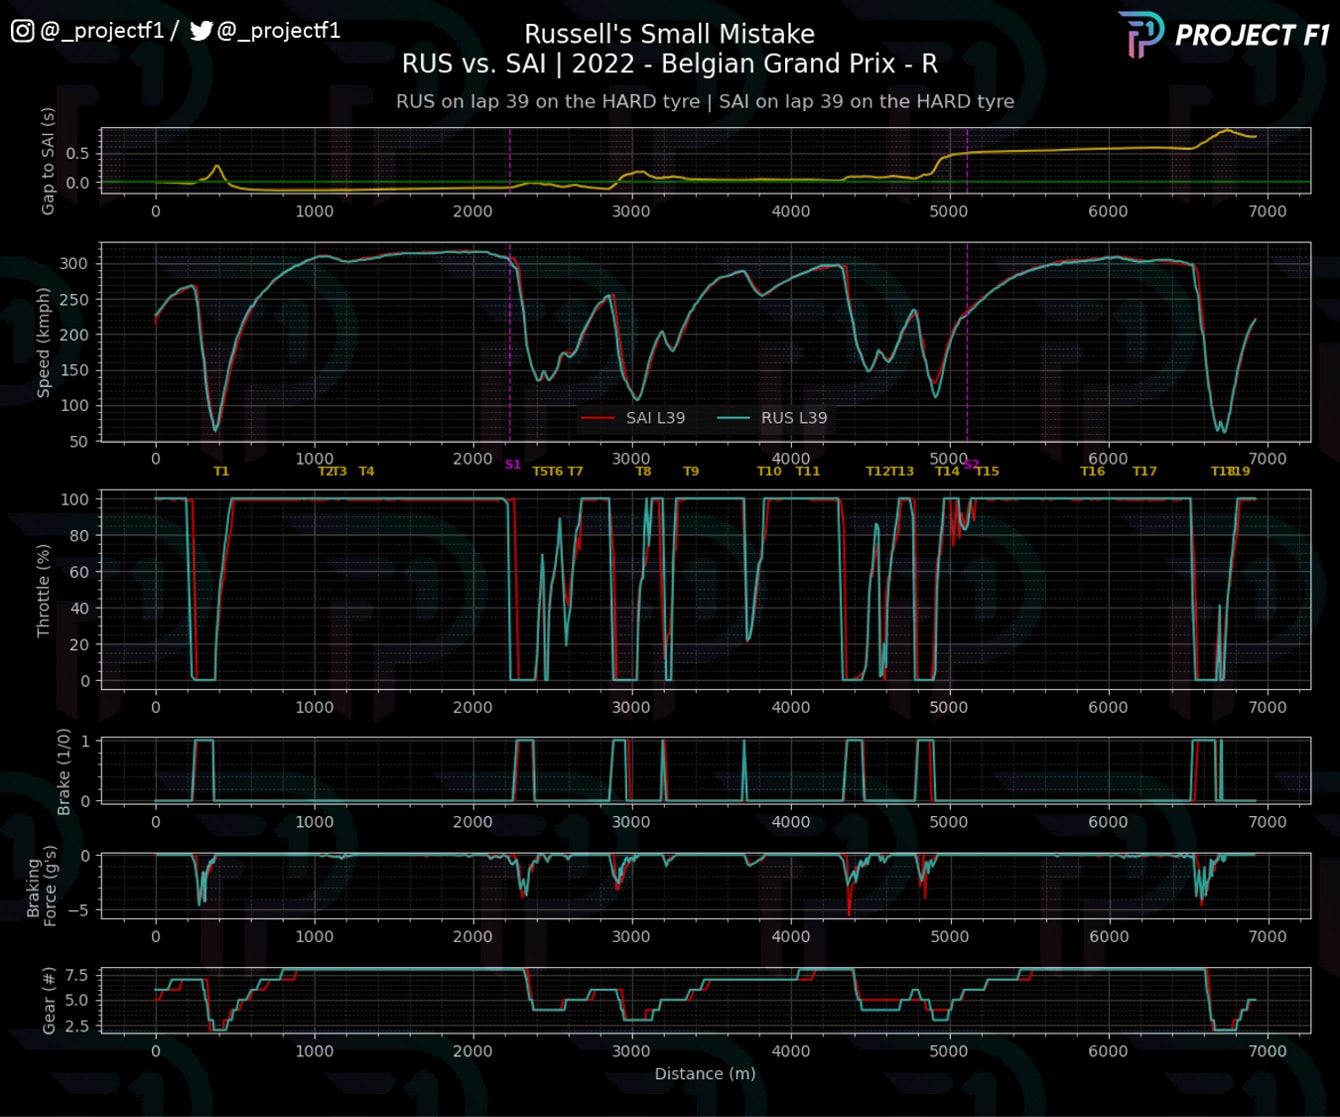
The gap around the solid purple line of Perez shows just how lonely the final part of his race was, but Sainz had to keep an eye on his rear-view mirrors as Russell made a late charge for the podium.


Verstappen’s dominance

Chart 2 Race pace compared

Belgian GP chart 2

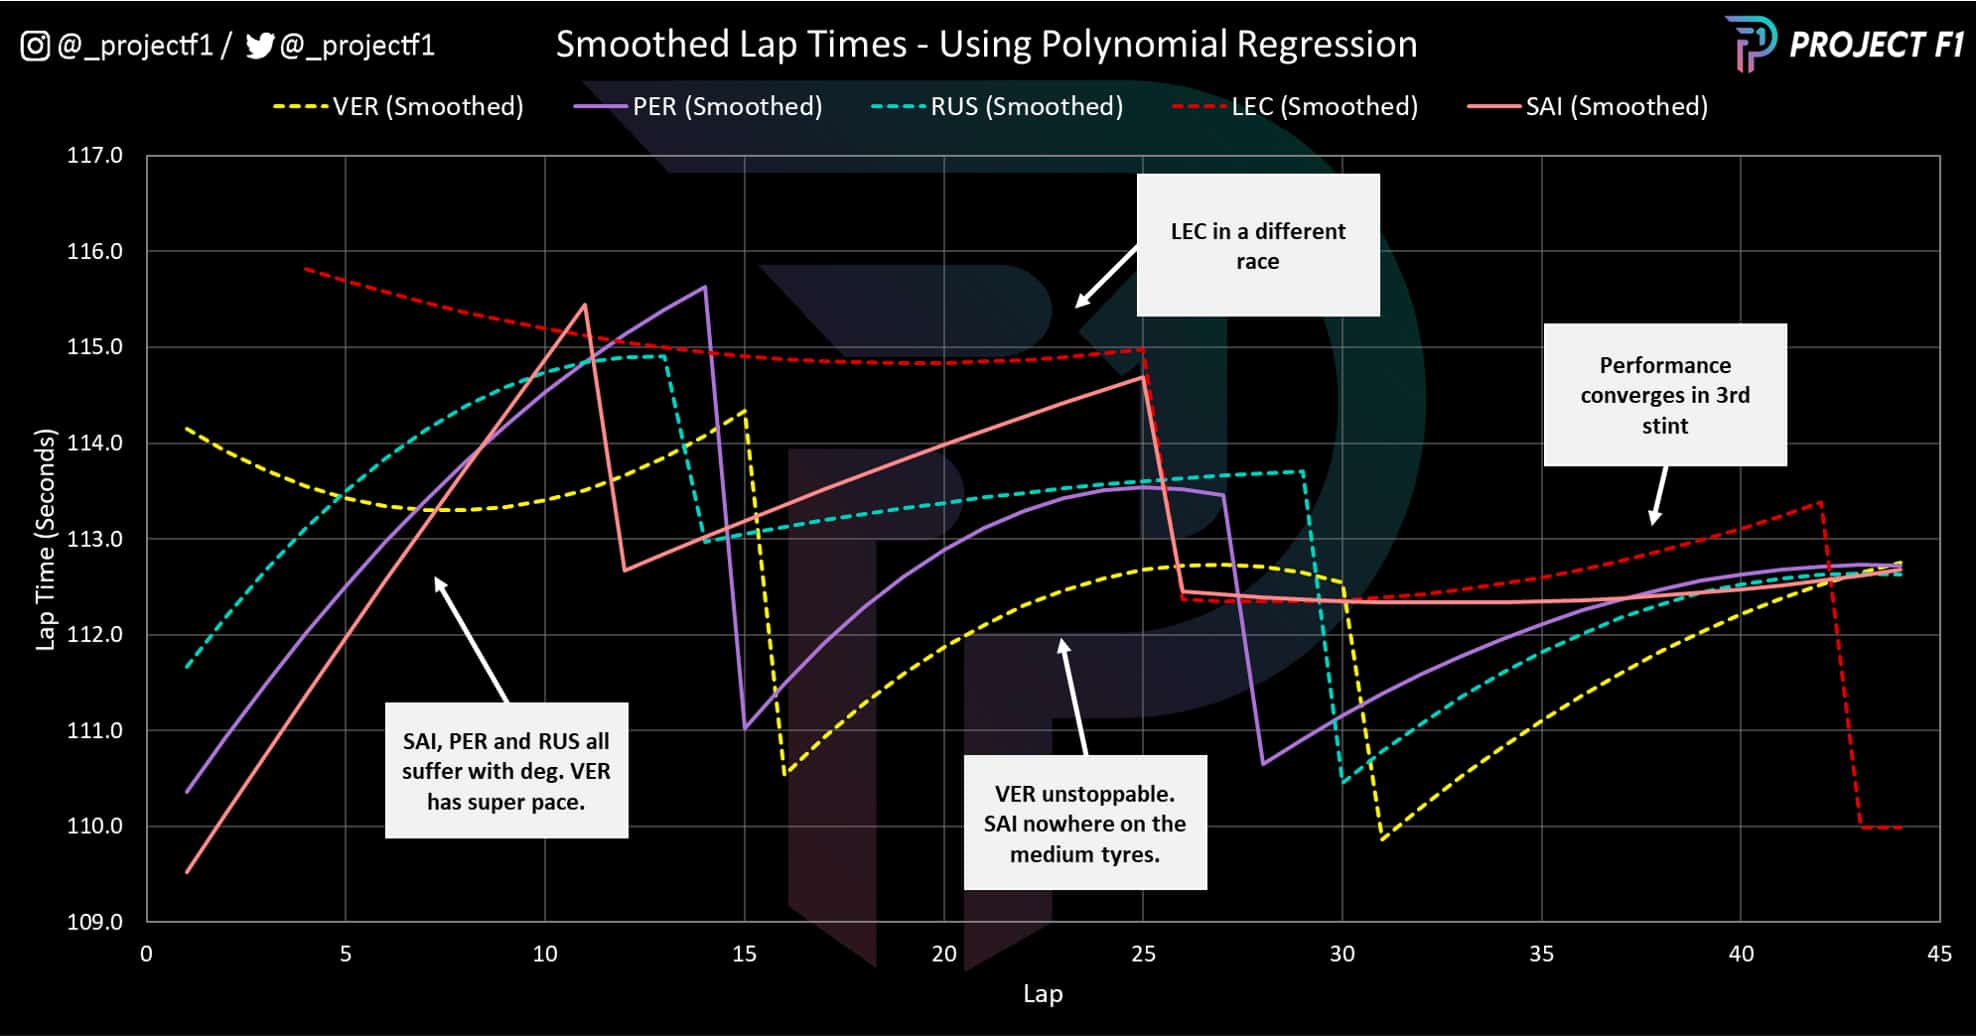
Chart 2 looks at the pace trend of each driver, smoothing out the anomalies to illustrate where drivers were faster and slower during the race. The effect of fresh tyres is clear, as lap times plummet following each driver’s pitstop.

From early on, the sharply-angled lines of Sainz, Perez and Russell illustrate how tyre degradation led to fast-falling lap times, whether they were on soft or medium tyres. In contrast, the gentle curves for Leclerc and Verstappen show them unaffected by excessive wear, and with increasing pace during the opening laps.

That brought Verstappen to the front where his performance was in a league of its own during the second stint: his yellow dotted line is almost a second clear of the solid purple line of Perez in second and he’s followed by Russell who makes up time on Sainz, still dogged by degradation issues.

Verstappen continues his dominance into the third stint, where Russell improves further, as the second fastest driver behind the Red Bull. Sainz’s pace, though slower than Perez, is finally stable, with similar levels of tyre degradation for all drivers.

Although Perez lost ground to Russell in the final stint, he had done enough in the first and second stints to comfortably finish second, while lagging his team-mate for the majority of the race.

Ultimately, Perez finished where he ought to based on his pace, though his starting position of second, compared with Verstappen’s 14th place grid slot, doesn’t suggest a strong performance.


Where it went wrong for Sainz

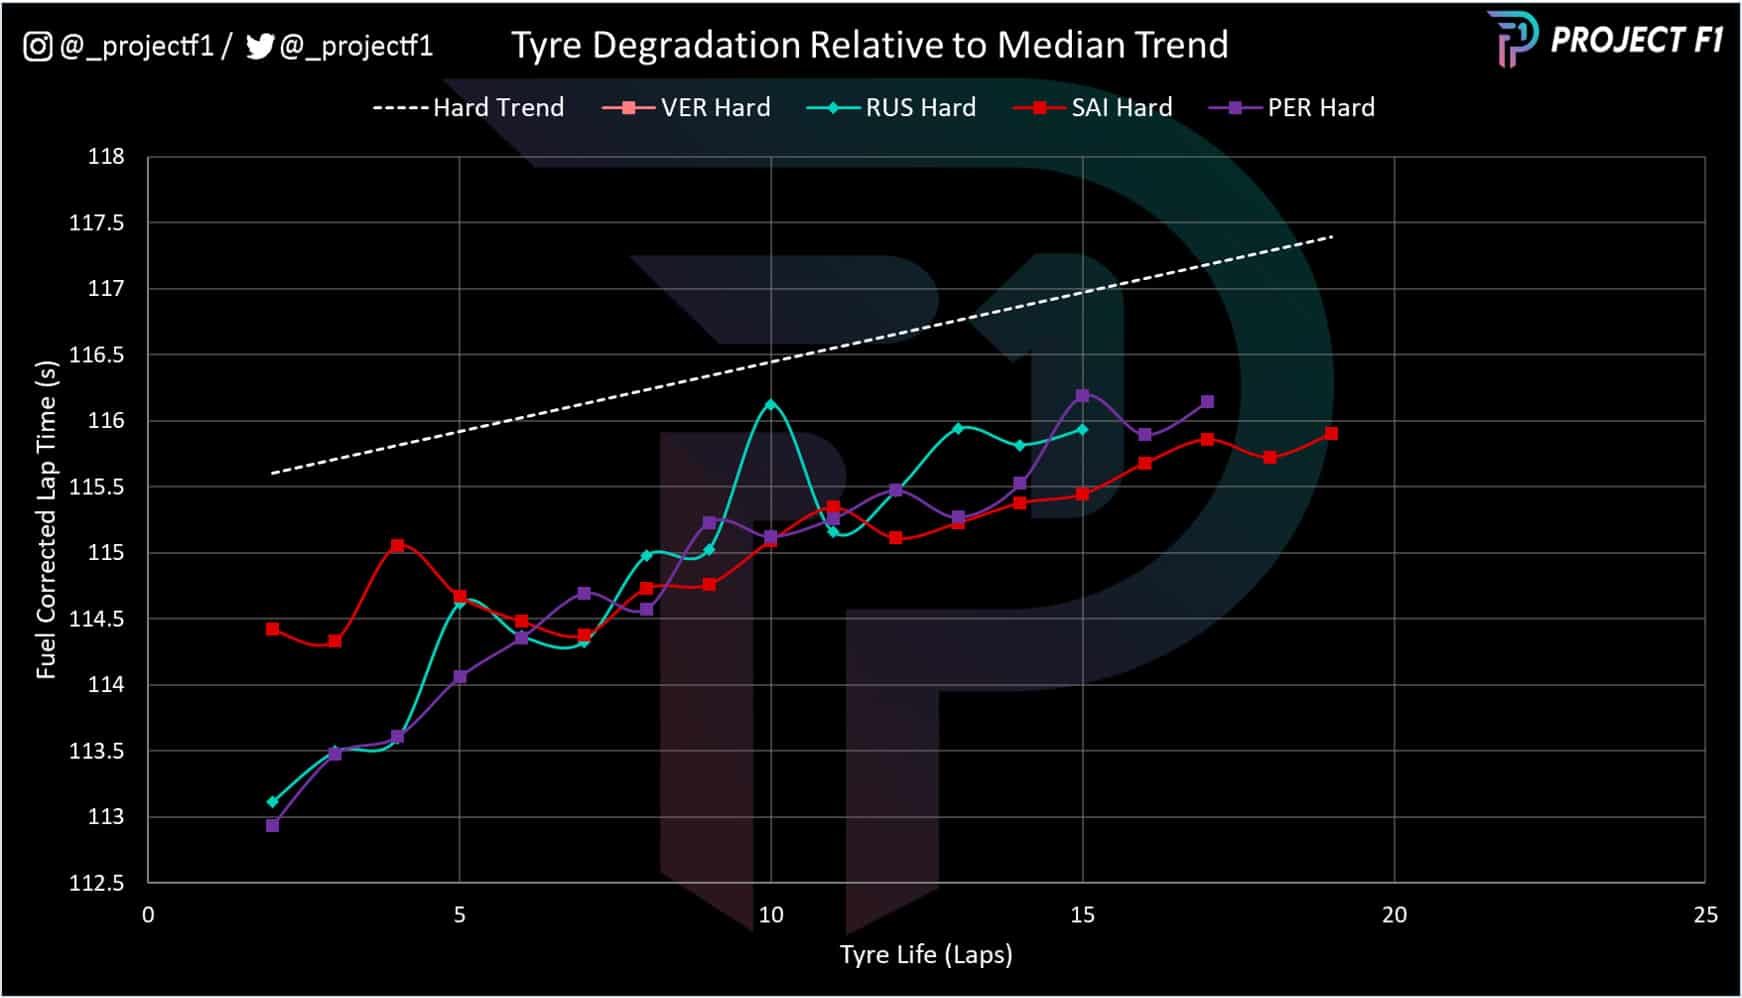
Chart 3 Sainz’s tyre degradation profile

Belgian GP chart 3

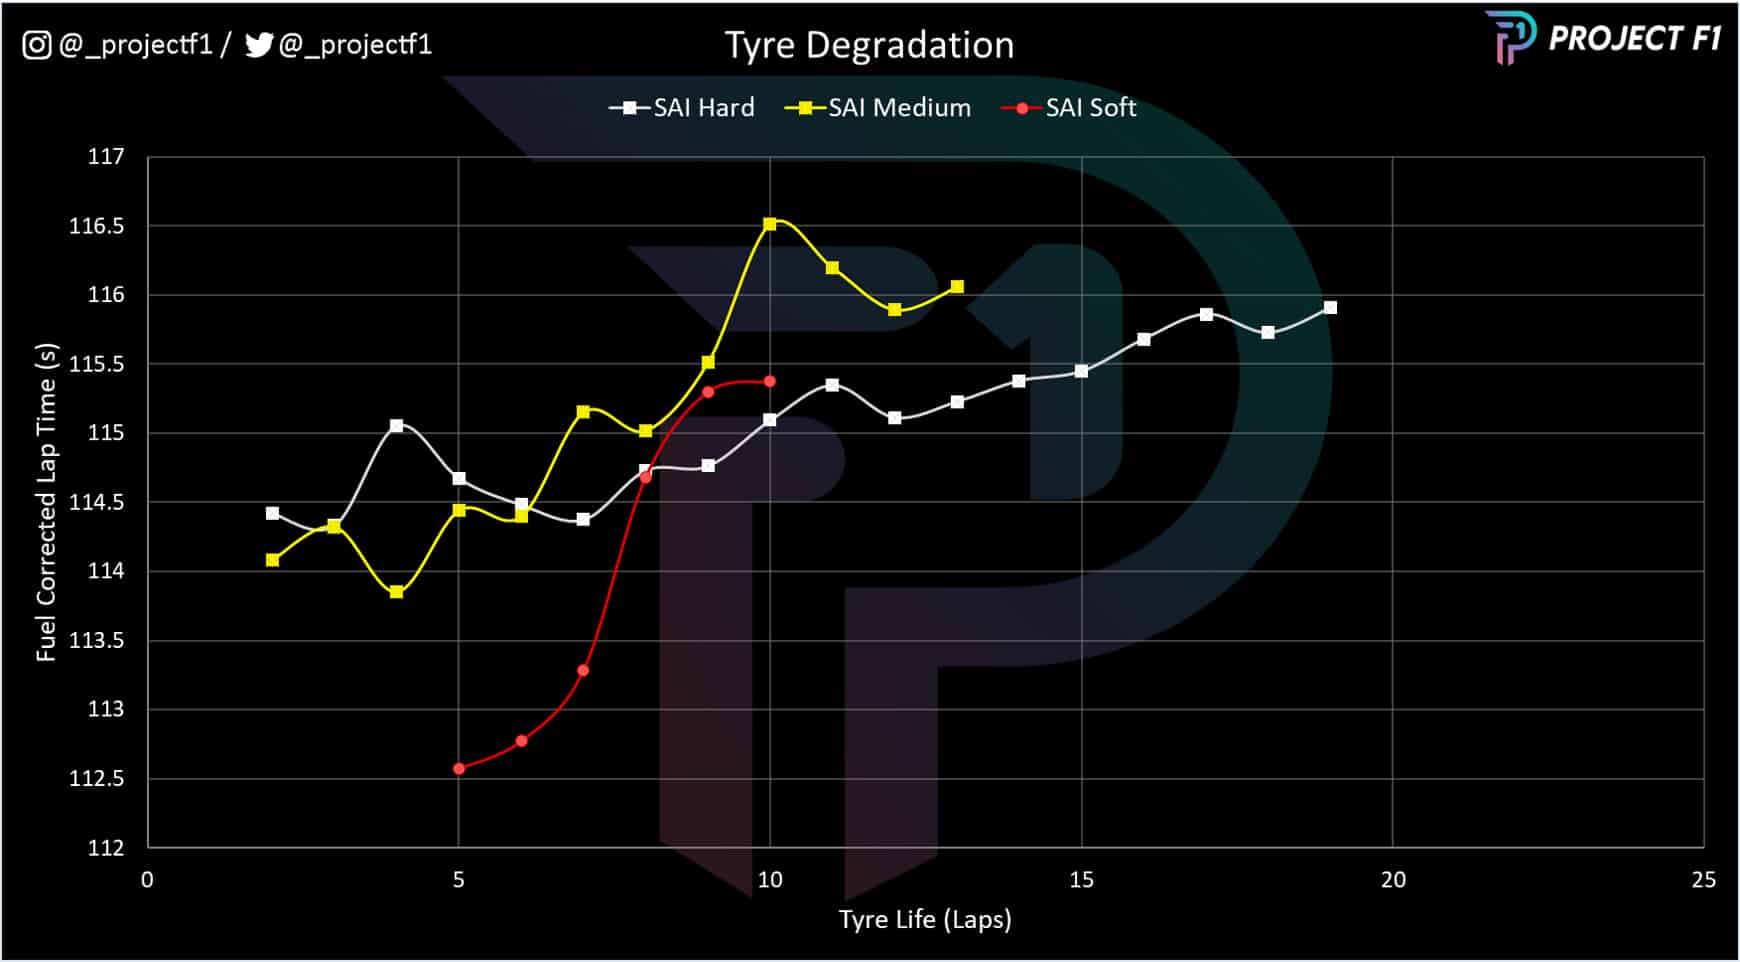
By correcting Sainz’s performance to account for his reducing fuel load, we can better see how tyres limited his pace.

Chart 3 maps his lap time on each of the three sets of tyres he used, with an immediate drop-off on the soft tyre from the safety car restart on lap 5.

Related article

From here it is clear to see just how poor Sainz’s pace was on the soft tyre, affirming the pace trend in chart 2.

Interestingly, Sainz’s stint on the medium tyre follows a similar trend. After six laps, his lap time is already slower than his pace on the hard tyre at the same point.

Only when Sainz fitted the hard tyre for his final stint did he see any sign of durability and consistency regarding pace. The hotter conditions and additional downforce were not Ferrari’s friend in the race.


Russell vs Sainz

Chart 4 Hard tyre degradation

Belgian GP chart 4

Chart 4 looks to compare the hard tyre degradation between the drivers, namely Russell and Sainz. Russell had the advantage for the first five laps, with the next five laps being more or less the same, but the Mercedes driver then tripped up…


Russell’s small mistake proves costly

Chart 5 Russell vs Sainz telemetry

Belgian GP chart 5

Russell slows on the 10th lap of his stint. While the following lap returns to trend, the remaining laps in the stint start to fall away relative to Sainz.

This may be down to a moment where Russell goes wide at T14 on lap 39 where his speed dips significantly below that of Sainz, shown in the telemetry above.

The error itself only cost about 0.5sec in margin to Sainz but the real damage was done with the loss of tyre temperature and the dirtying of the tyres. From this point Russell keeps losing pace and the steam evaporates from his charge to challenge for Sainz’s podium place.

Despite having better performance for most of the race, Russell lost momentum in the closing stages where it mattered the most. P4 is still a solid outcome for Russell and Mercedes, but potentially falls short of the absolute maximum.

In the opposite vein, Sainz had to fight tooth and nail to just hold onto the podium in a fight that neither he nor Ferrari should be having: a thought that may have also crossed Leclerc’s mind in the final laps as well.


Project F1 turns data into graphics that uncover race pace and strategy
See more analysis at @_ProjectF1 on Twitter or @_ProjectF1 on Instagram