Revealed: Charles Leclerc's severe throttle issue, plus his sensational pace — Austrian GP data analysis

F1

The closing laps of the 2022 Austrian Grand Prix saw Charles Leclerc fend off Max Verstappen despite a sticky throttle. Examining the data shows just how much it was staying open through the slowest corners — and how quick his Ferrari had been for the rest of the race

Ferrari graph header

Getty Images

On Saturday afternoon, in front of a home crowd, Max Verstappen looked cool and in control as he won the Austrian Grand Prix sprint race. But if you looked in the right place, the clues were there that he may not have such an easy ride on Sunday.

Tyre wear was the key factor. Made worse by cooler temperatures on the Sunday, plus overnight rain that had washed the track, as explained by Mark Hughes, it torpedoed Red Bull’s chance of winning the Grand Prix.

The data shows Verstappen’s pace may have been affected by similar wear on the Saturday, hinting at the problems he would face.

The graphs are a stark illustration of just how superior the Ferraris were on pace, with victory rarely in doubt, showing that it’s far too soon to write the team out of the title race.

Telemetry also clearly shows the extent of Charles Leclerc’s throttle issue, with the pedal stuck open by at least 15% at almost every point on the circuit.

Ferrari’s pace advantage also made its strategy calls simpler in the race, Carlos Sainz’s engine fire may make them easier in the long-term too.

The British GP-winner’s retirement left him on 133 points in the championship, 37 behind his team-mate. With half the races now run, it could be the decisive factor in the team choosing to favour Leclerc in the championship.

The sprint race showed how harmful a Ferrari battle can be, as Sainz and Leclerc fought for second place, leaving Verstappen untroubled in front, as seen in our first graph.


Austrian GP sprint race

Chart 1: Race Pace, distribution from the sprint

Austrian GP lap time distribution graph

Sprint races bring a rare opportunity to gauge race pace in more representative conditions than free practice, and it was clear after Saturday in Austria that Verstappen and Leclerc were virtually equal.

The white lines on the chart above show each driver’s full range of lap times during the sprint. The coloured blocks illustrate the variation in the 50% of laps that were closest to the race average, and the black line between the two colours is that driver’s (median) average lap time.

Related article

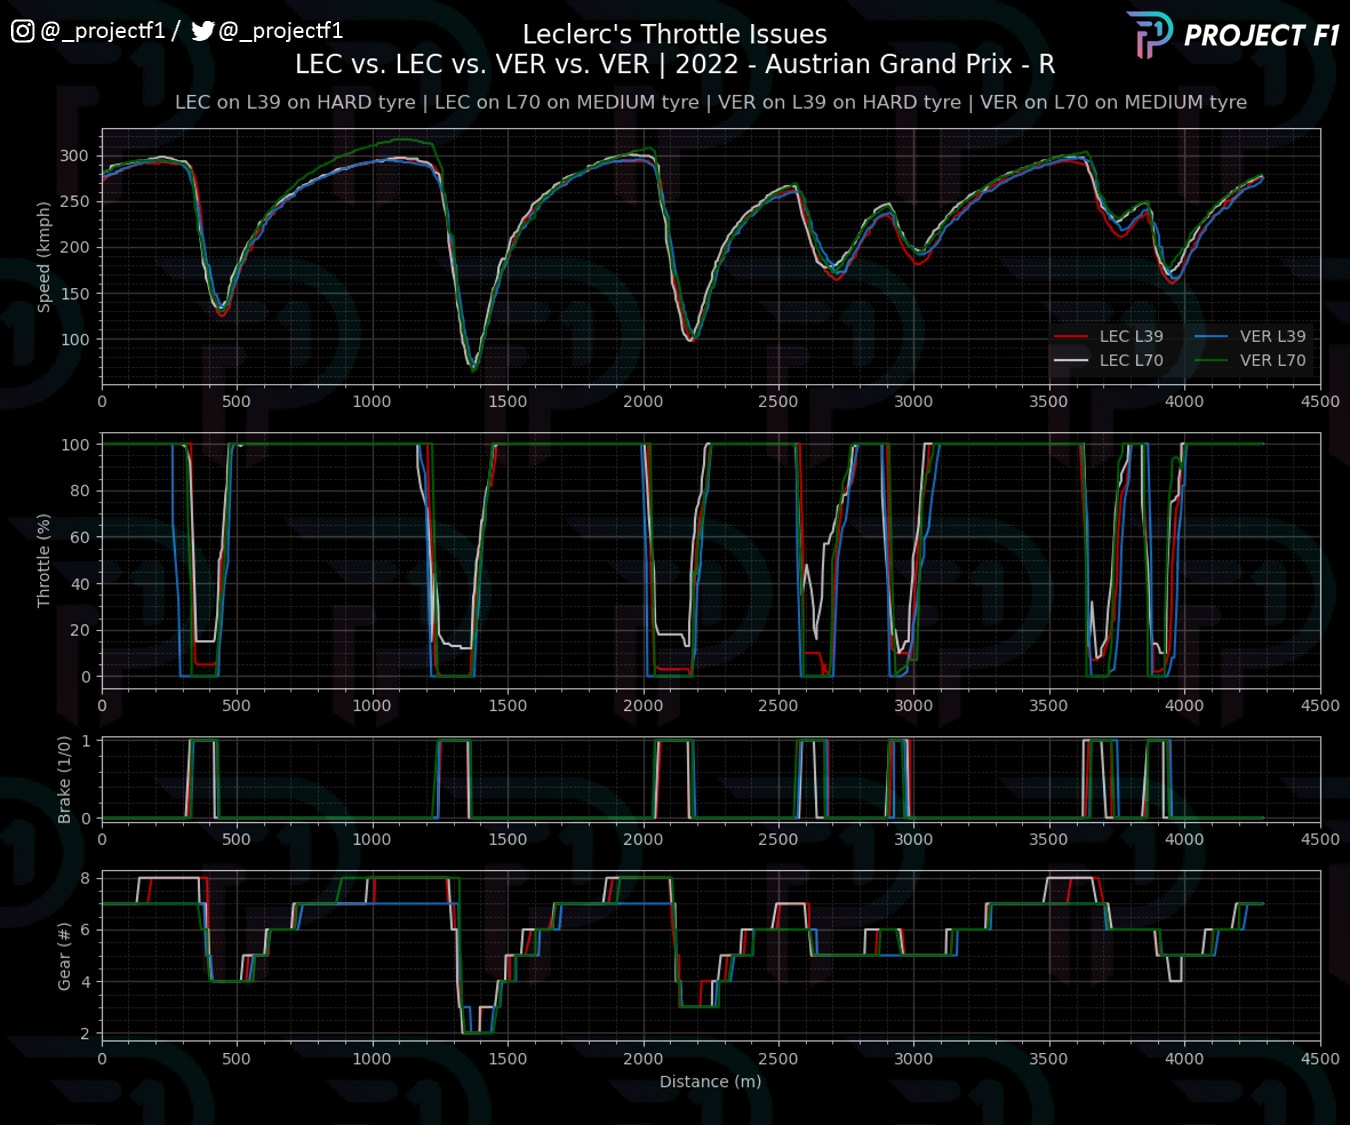
Here, Leclerc demonstrates more consistency, hinting at Red Bull’s tyre issues to come.

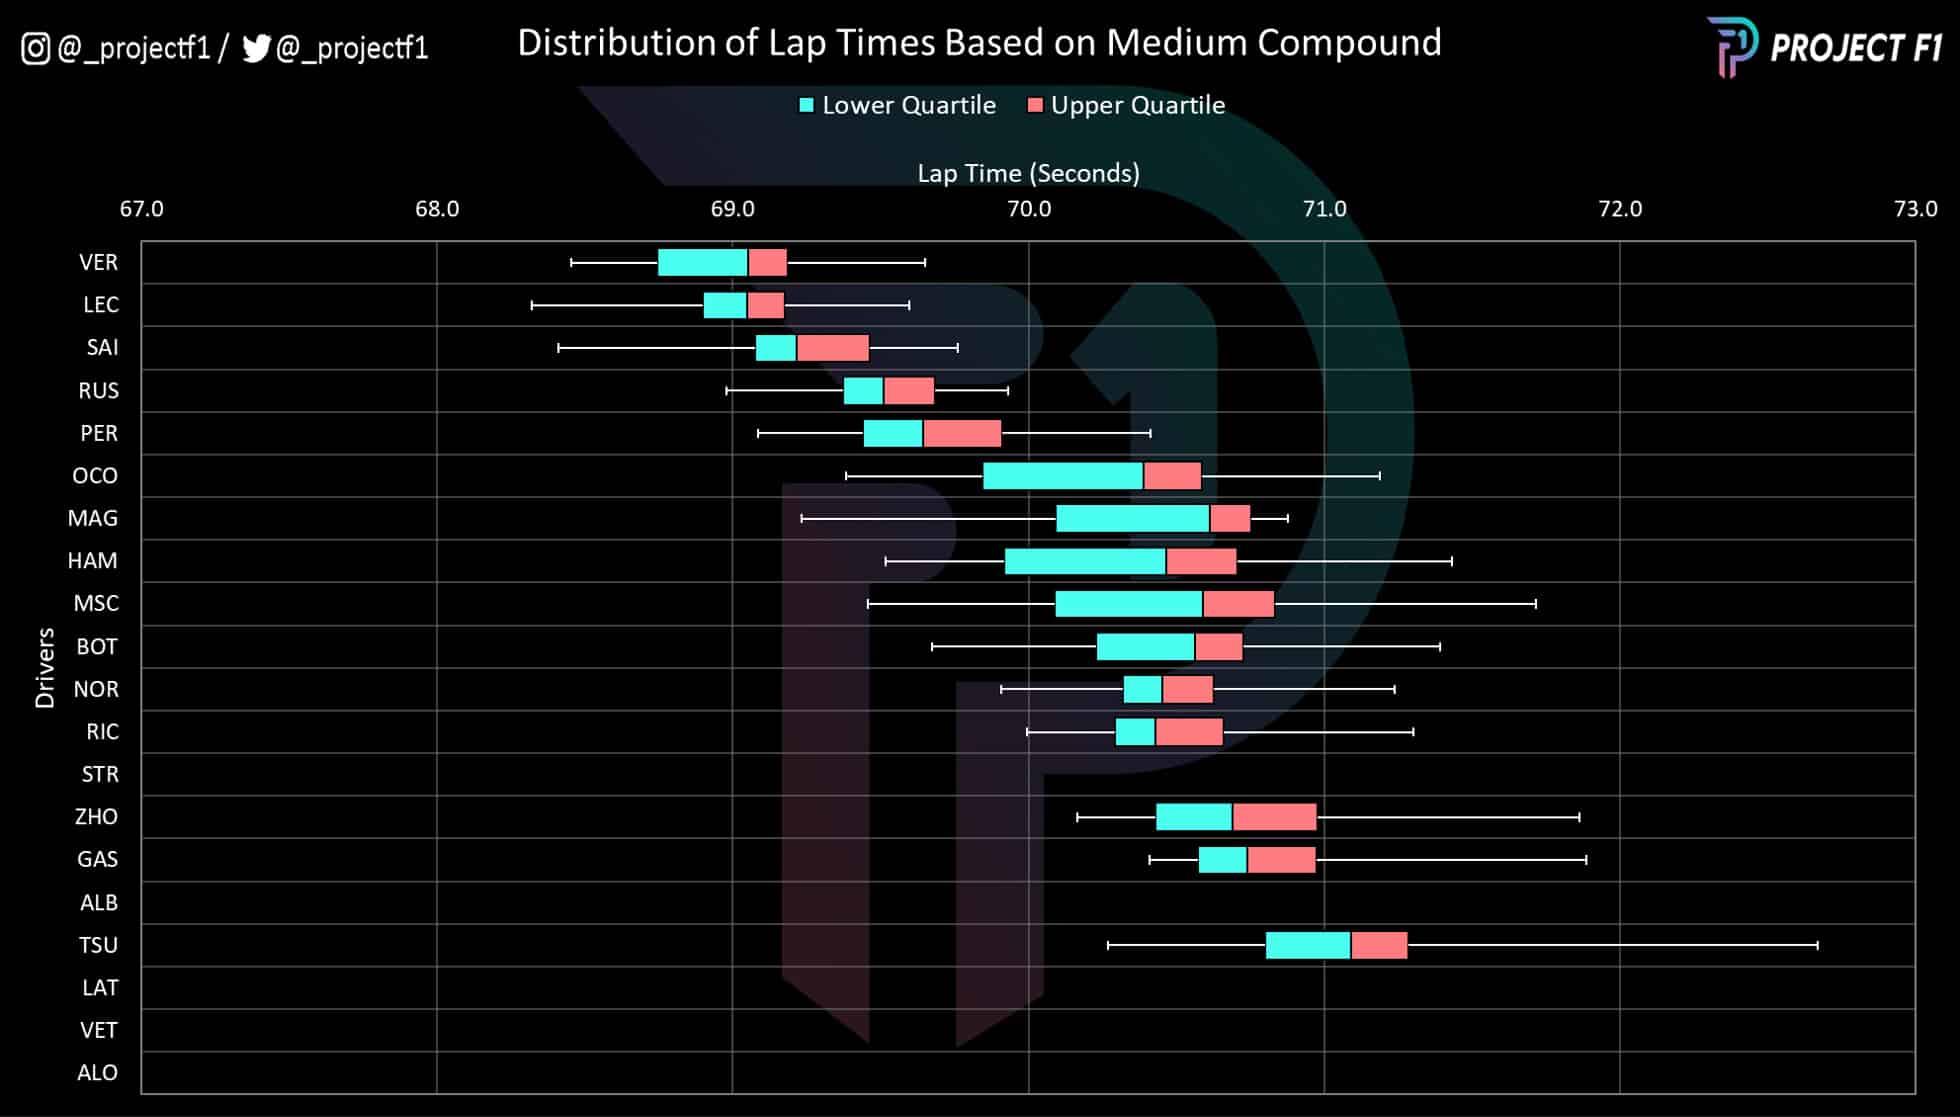
Of course, the matched pace wasn’t reflected in the result because of Leclerc and Sainz’s squabbling at the start, which ruined both drivers’ chances of mounting a challenge against Verstappen.

As well as giving the Red Bull driver a healthy lead, it also showed the consequences of burning out your tyres, as Sainz had to back off after locking up in an attempt to pass Leclerc, leaving a material gap to his team-mate with regard to median pace.


Chart 2: Trend Sprint Race Pace Compared, Verstappen vs Leclerc

Austrian GP Leclerc and Sainz lap time graph

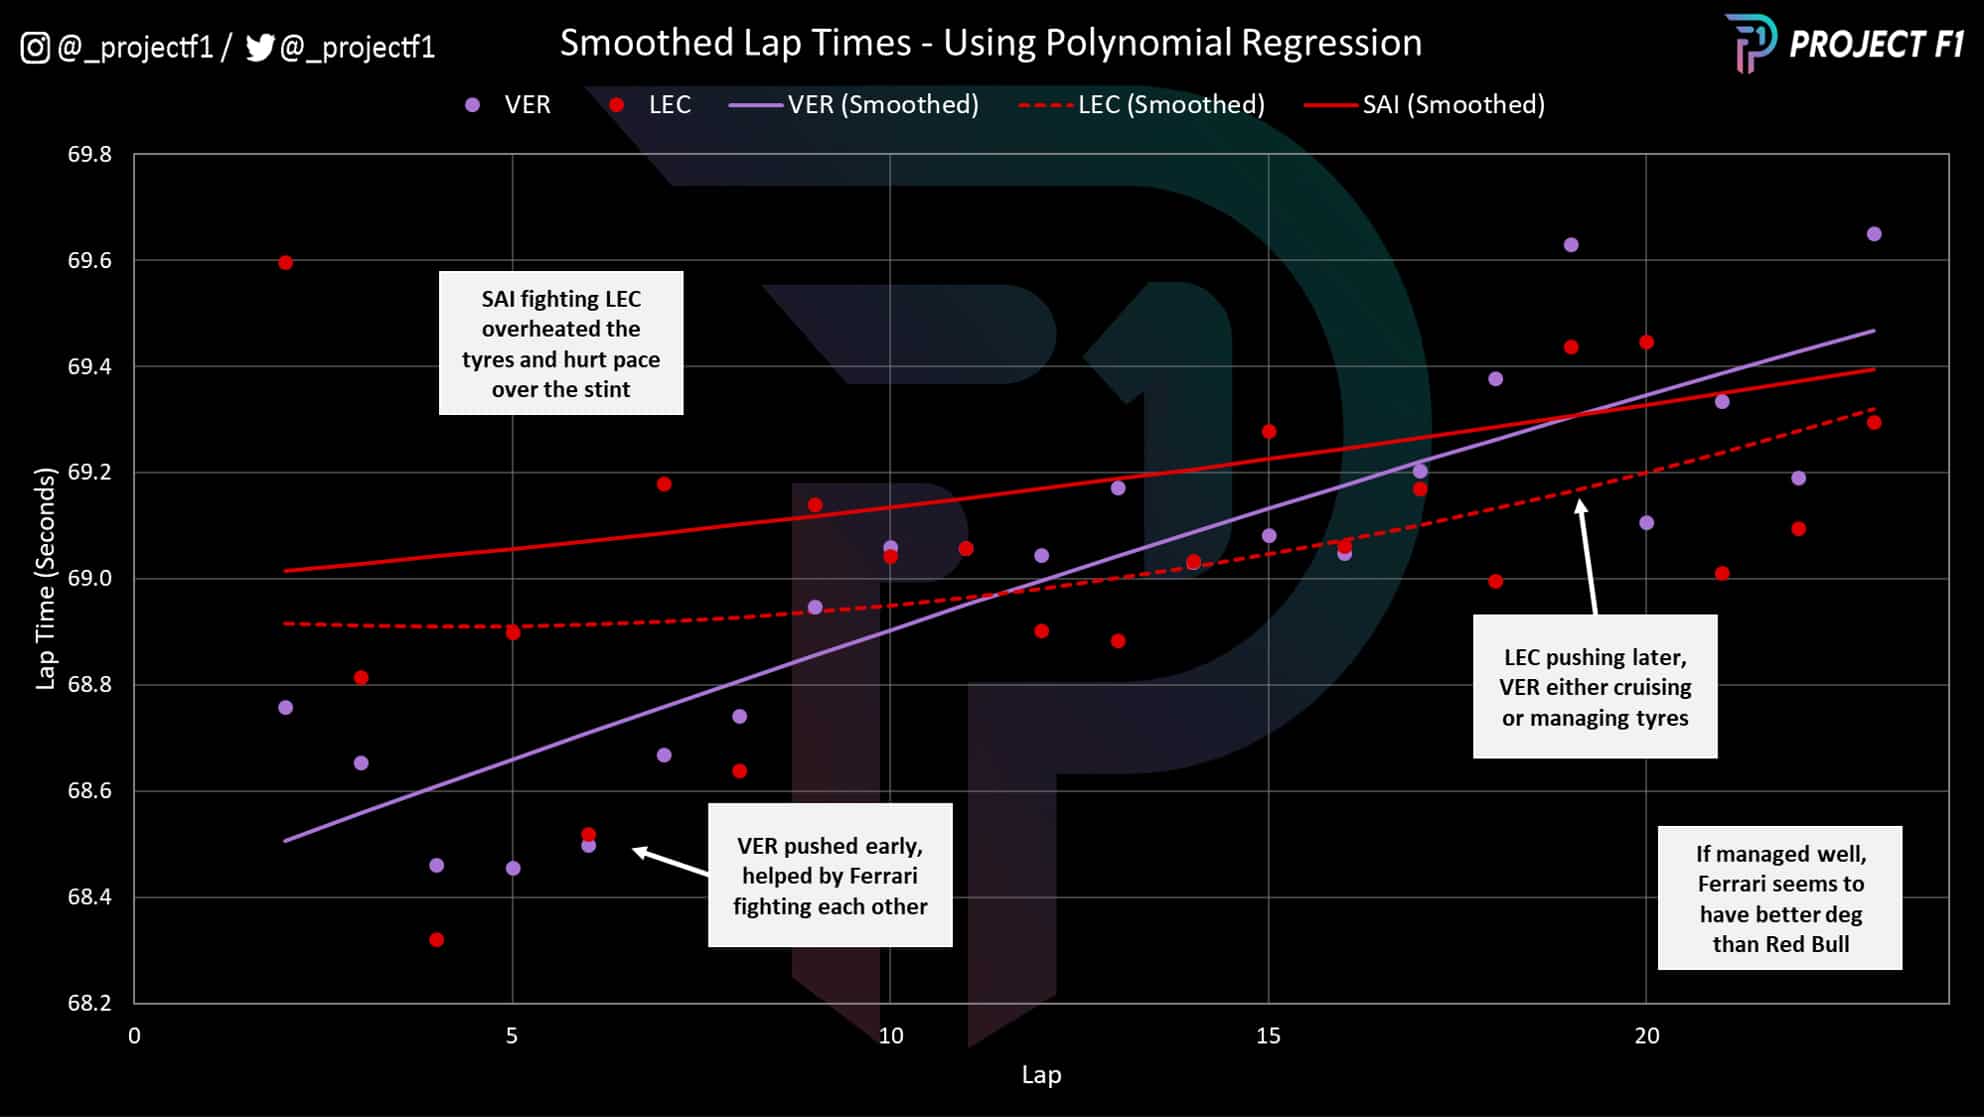
Staying with the sprint, this chart breaks down how Verstappen and Leclerc extracted the pace from the medium tyre. Verstappen pushed hard early on while Leclerc took it easier after the battle with Sainz.

Despite Leclerc’s early qualms, the flatter slope of the trend pace compared to Verstappen points to a better degradation profile. This would be exacerbated by Verstappen taking it easy, given his gap to Leclerc.

The signs were there that Red Bull had a weakness that could be exploited in the grand prix, especially given the higher fuel loads that increase tyre degradation. But Ferrari would need to grab the opportunity with both hands.


Austrian GP

Chart 3: Race Story, cumulative delta plot

Cumulative lap time graph from Austrian GP

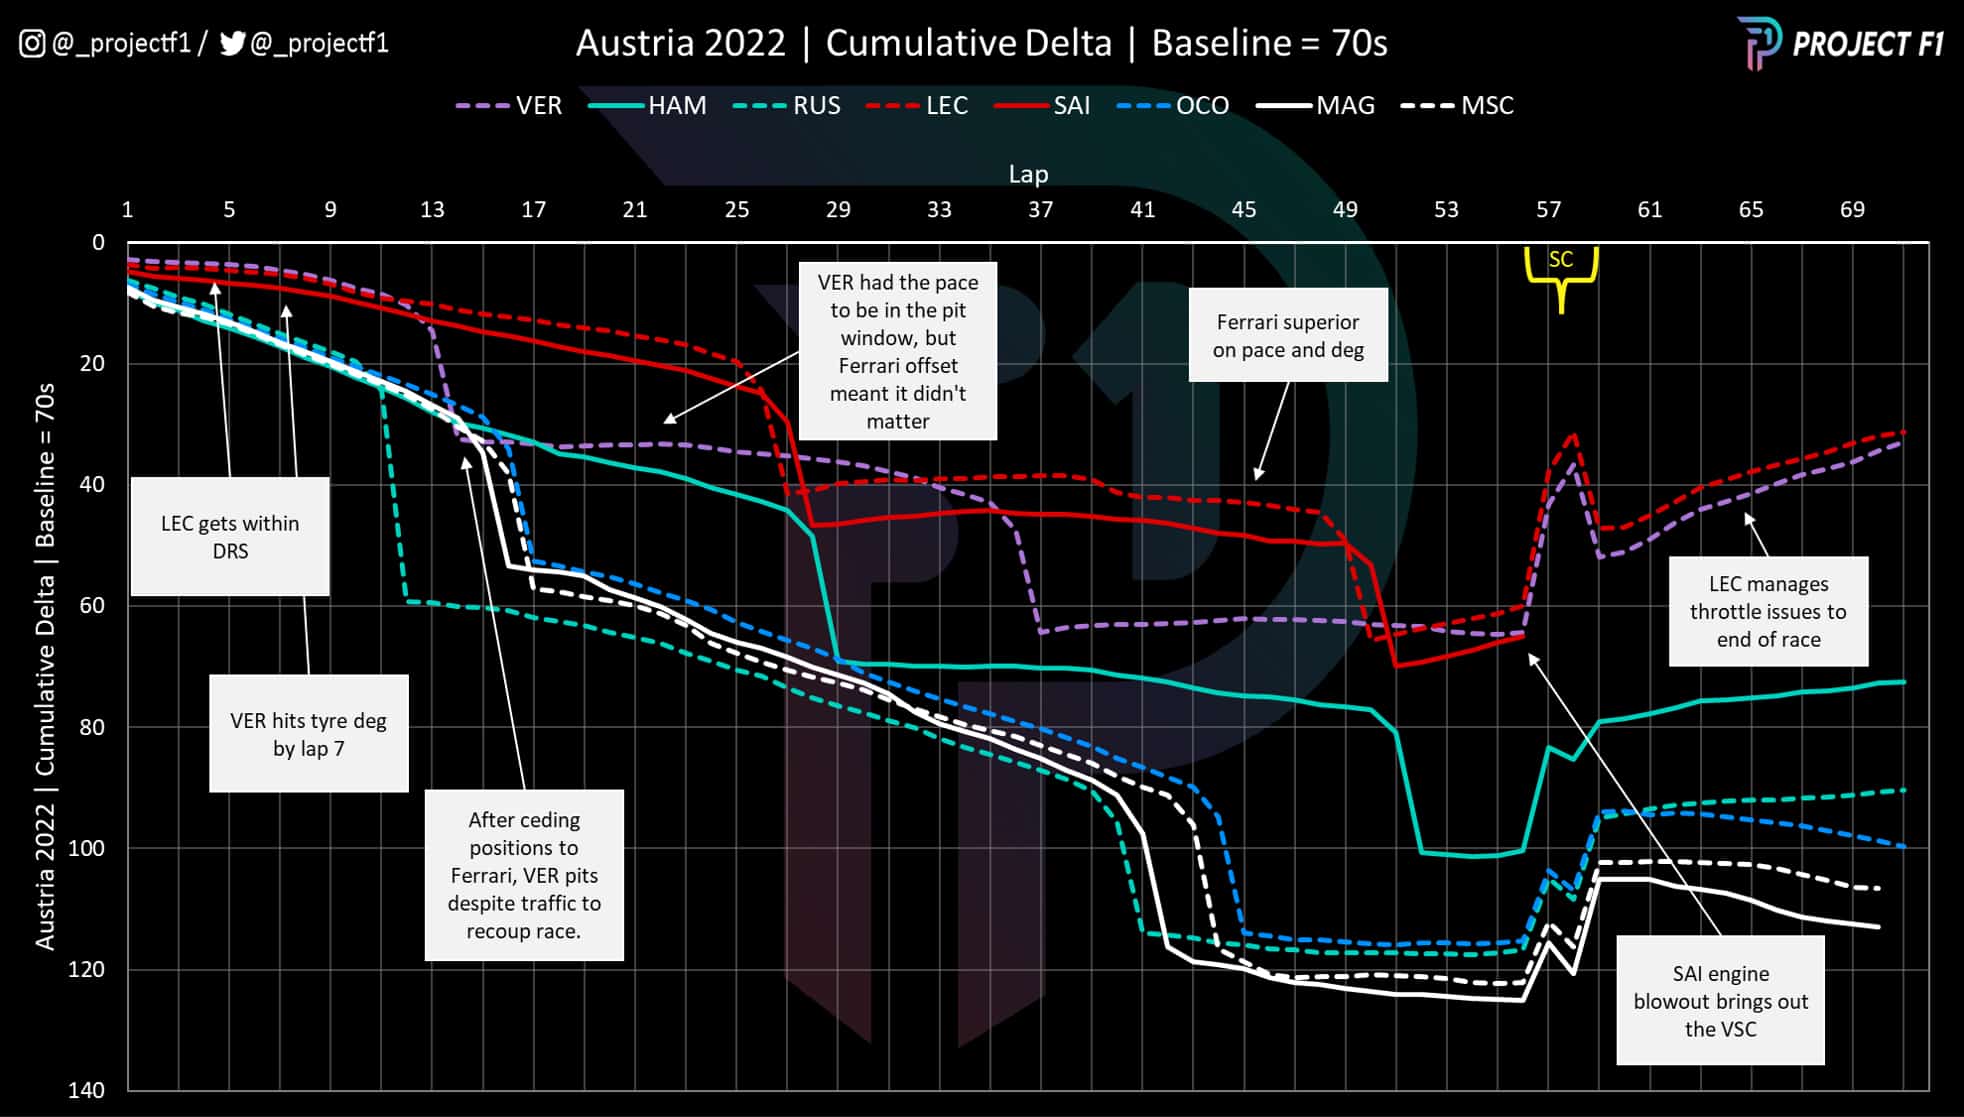
As the lights went out for Sunday’s Grand Prix, Sainz again found himself in battle for position, but in this case he was defending against George Russell.

This may have been fortuitous for Ferrari, as it meant that its drivers weren’t tripping over each other.

It didn’t take long for Leclerc to move within DRS range and the chart above, showing drivers’ average lap times as the race progressed (compared to an average 1min 10sec lap), illustrates how closely the two frontrunners were matched.

By lap 7, Verstappen was already facing a drop-off in pace as his tyres wore substantially quicker than in the sprint.

The drop off was so bad that Red Bull’s best course of action was to swiftly bring Verstappen into the pits to change for a fresh set of hard tyres and remount a challenge for the lead of the race.


Chart 4: Tyre strategies, summary

Austrian GP tyre strategy graph

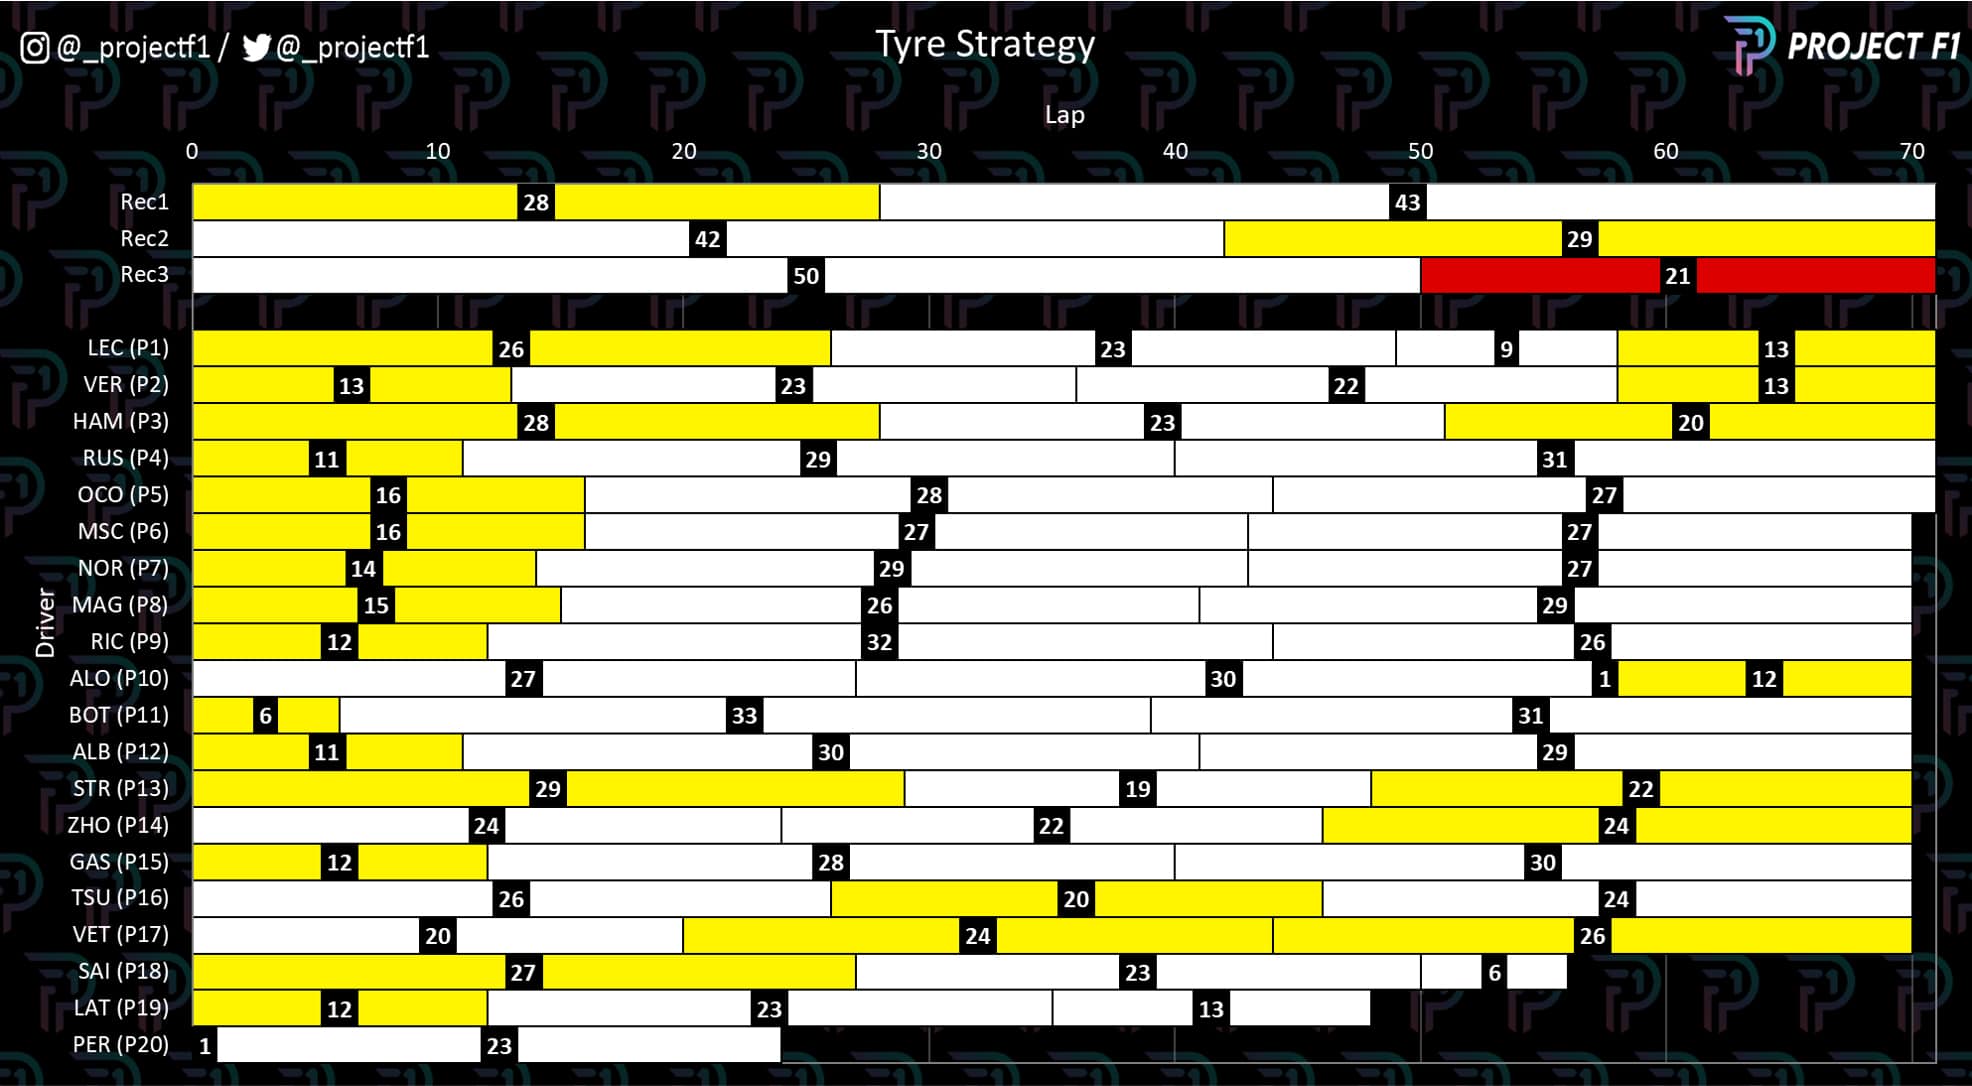
Pirelli’s recommended scenarios at the top of the chart suggested that a one-stop strategy would be the fastest option in Austria, but Verstappen’s early stop on lap 13 forced Red Bull into a two-stop strategy, with Ferrari retaining the option to go either way.

While not ideal for Red Bull, it was an assertive call to pit promptly, rather than wasting time and performance trying to extend Verstappen’s stint and explore alternate strategy options.

Ferrari opted to keep both drivers out and not split the strategy with one driver covering off against Verstappen. Splitting the strategy seemed to make more sense so that it could cover more bases (like betting on black and red at the same time).

However, Ferrari’s pace and much lower degradation was so good that going all-in on the longer first stint for both drivers was not only feasible, but the dominant strategy choice.

After several races of questionable calls, this was a race where Ferrari got it right.


Chart 5: Trend race pace compared, Verstappen vs Leclerc

Austrian GP smoothed lap times

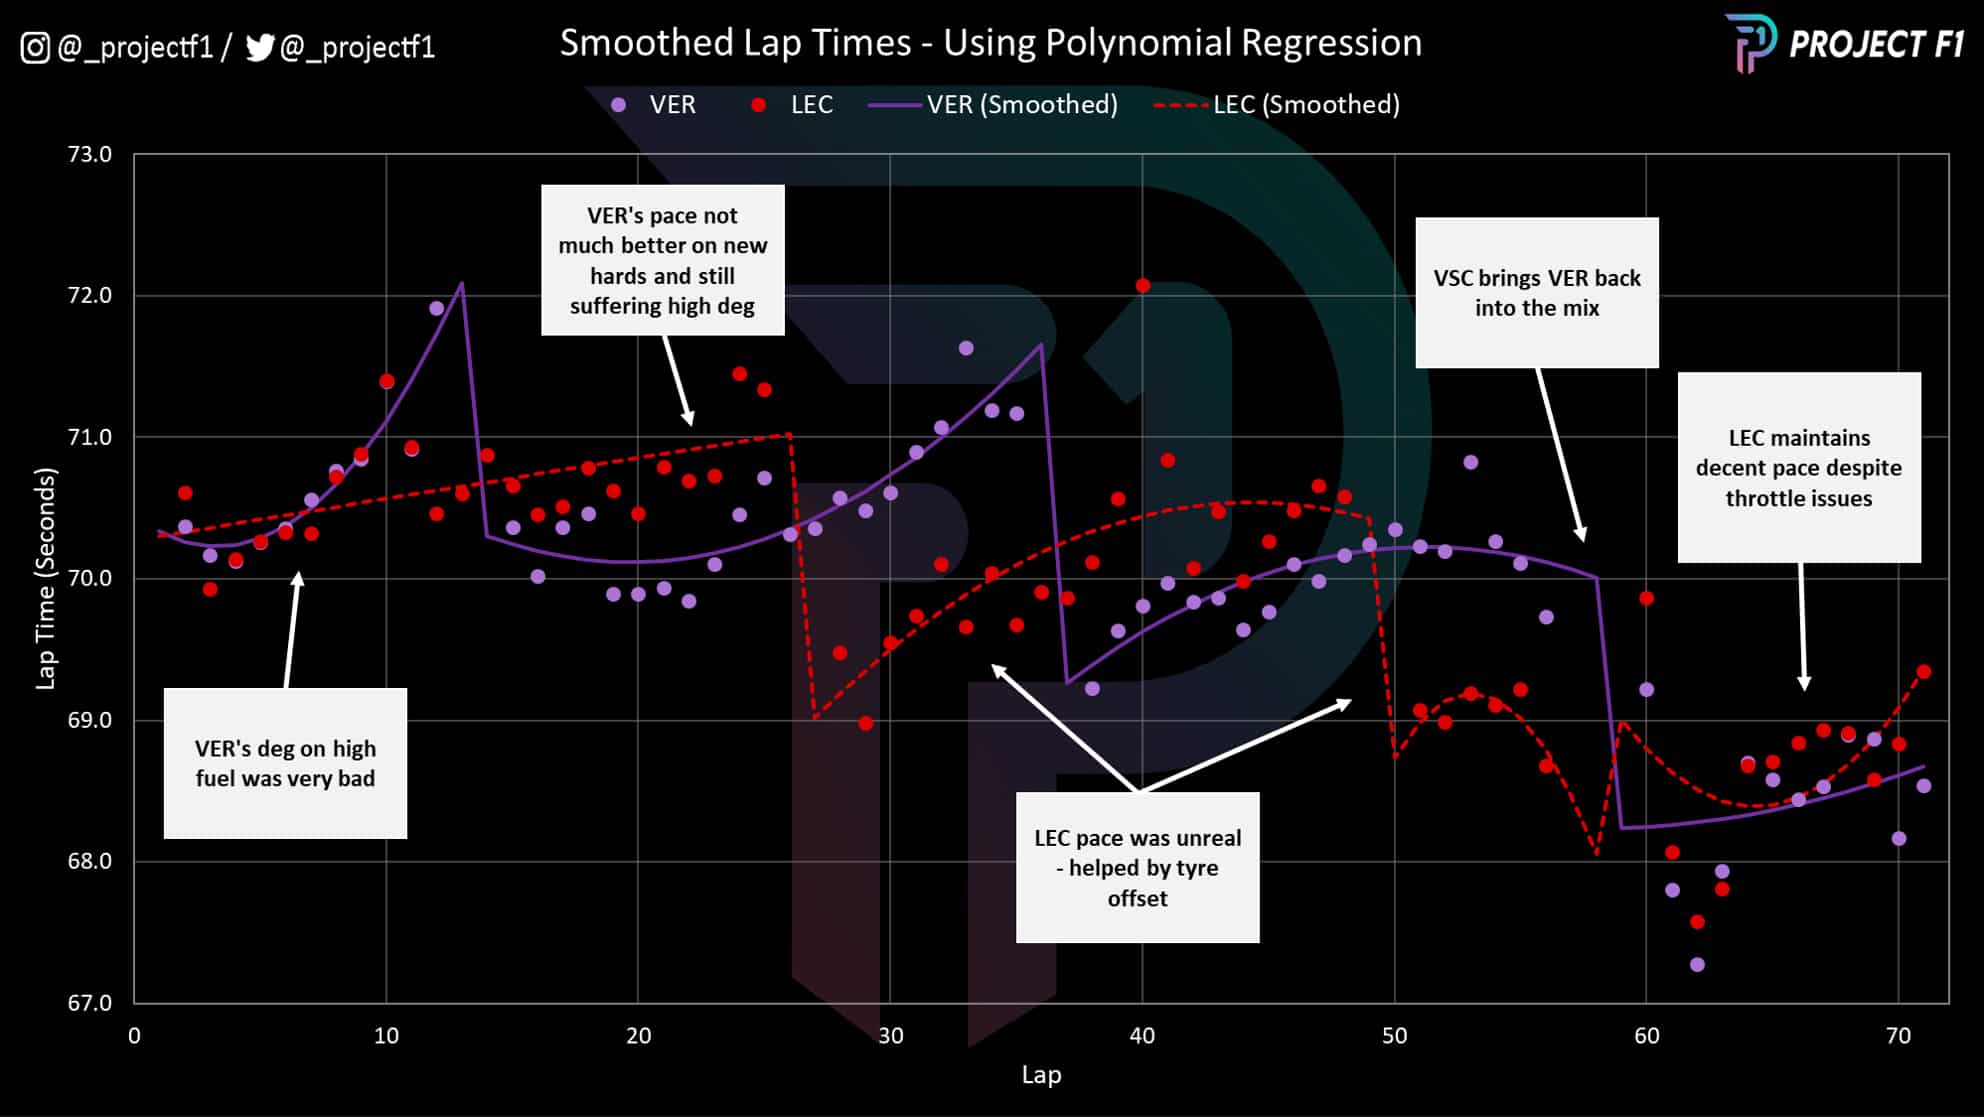
Ferrari’s superiority is clear in the chart above, which maps the pace differential between Leclerc and Verstappen.

Despite having fresh hard tyres, Verstappen wasn’t much faster than Leclerc on old mediums (between laps 13 and 24). To make matters worse for Red Bull, Leclerc was significantly faster than Verstappen after switching to the hard tyre during his second stint – helped handsomely by the large tyre offset from the longer first stint.

Related article

By this time, Verstappen’s hard tyres were degrading at a faster rate, and he was back to the lap times he set on the medium tyres just before he pitted, despite having a lower fuel load.

Verstappen’s pace would return when he pitted again but Leclerc came back with a greater ramp up in pace after his second stop.

The race looked settled until Sainz’s dramatic engine blowout that not only took him out of the race, but also provided Verstappen another opportunity to attack for the lead, when he and Leclerc pitted for medium tyres under the virtual safety car.

His chances improved further shortly after the restart, when Leclerc began to experience throttle issues – whereby the pedal would not go completely to the 0% setting, going on to compromise the Monegasque’s race.


Chart 6: Telemetry analysis, Leclerc’s throttle issues

Charles Leclerc throttle trace

The extent of Leclerc’s throttle issue is laid bare in chart 6, which compares Leclerc and Verstappen’s telemetry traces from lap 39, as well as lap 70, when the problem had emerged.

The standout detail here is how the white line (showing Leclerc on lap 70) barely goes below 15% throttle input. Although on a typical lap, Leclerc rarely goes to 0% even in slower corners, the red line showing his lap 39 trace shows that his slight throttle application is still much lower than what he experienced with the pedal issues on the final lap. Comparing this to Verstappen and the difference is even more stark.

That said, Leclerc’s driving style of dabbing the throttle to help rotate the car after deep and late braking was likely to be an assisting factor in being able to tolerate the pedal issues without suffering too much time loss to Verstappen.

The final stint in Chart 5 shows a performance loss, but it was still good enough to match some of Verstappen’s times – albeit with Max sometimes in traffic, and his determined drive brough a long-awaited win.

That helps Leclerc claw back 5 points in the driver’s championship, but it could have been more had Sainz finished second.

Could it be a hidden blessing for the team though? The 37-point gap between Leclerc and Sainz may help Ferrari focus its efforts and strategy calls on one driver rather than splitting it between two. Given team principal Mattia Binotto’s reluctance to enact team orders, the result in Austria may be the helping hand Ferrari needs to start optimising outcomes for one driver, just as it’s showing impressive pace.

Perhaps this is the start of an upswing of momentum.


Project F1 turns data into graphics that uncover race pace and strategy
See more analysis at @_ProjectF1 on Twitter or @_ProjectF1 on Instagram