The race Sainz should have won? What the Canadian GP data shows

F1

Carlos Sainz appeared to have a golden chance for his maiden F1 victory at the 2022 Canadian GP. We examine the data to see where it went wrong for him

Carlos Sainz holds trophy on the 2022 Canadian GP podium

Sainz had to settle for second behind Verstappen in Canada

Florent Gooden/DPPI

In the lead, with what appeared to be the fastest car on track, Carlos Sainz may have thought that Montreal would finally be the moment of his debut Formula 1 win.

There was no threat from his team-mate, who had started 19th, nor Sergio Perez who retired early on. And Max Verstappen seemed to have his work cut out after pitting early.

It was a golden opportunity for the Spaniard to claim victory, and yet — after pitting under a safety car and trading track position for fresher tyres — he trailed Verstappen by 0.9sec at the flag.

Was he the victim of unfortunate timing, or should he really have won the race? Let’s see what the data shows.

Chart 1: Race Story, cumulative delta plot

Canada GP data graph cumulative

A wet qualifying session brought an opportunity for Sainz to set himself up for the race, with his team-mate out of the way. He was looking good for a front row start until he got over-eager and out of shape in the final corner, compromising his lap. Sainz relinquished his claim to P2 as a result, with Fernando Alonso taking the accolade and advantage.

But although he started on the second row of the grid, Sergio Perez’s error, which saw him out of qualifying in Q2, put him out of play to interfere with Sainz’ campaign. The cards were in Sainz’s favour to mount a serious challenge.

As the race got underway, Verstappen had a clean and unchallenged getaway, with Alonso focusing on his defence against fellow compatriot Sainz. This defence would be short-lived, with Sainz clearing his former idol in a few laps and making his pursuit towards the championship leader.

You can see his early progress in the graph above by following the solid red line that represents his cumulative pace. The chart plots drivers’ average lap time over the course of the race, dividing their total race time by the number of laps completed. This is compared with the average 1min 18sec lap time of the leader.

However, Sainz faced some early graining on his medium tyres, stalling his progress as the gap to Verstappen remained relatively stable until Perez ground to a halt on lap 7.

The ensuing virtual safety car provided a chance for a cheap pitstop and Verstappen took the opportunity, solving his own graining issues with a set of clean and robust hard tyres.

Ferrari elected to keep Sainz out and the Ferrari driver took the lead. The decision was sensible, as mirroring the strategy would reduce the battle down to a straight fight on pace. The advantage would then seem to lie with Verstappen based on earlier weekend running.

This way, Ferrari’s strategy gamble could yield benefits from a tyre offset.


Chart 2: Tyre strategy

Canada GP data graph tyre strategy

Two virtual safety cars (VSC) in the first 20 laps, followed by the full safety car later in the race, skewed team tactics so that Pirelli’s three recommended strategies, shown at the top of the chart, had to be adapted.

Sainz was able to work through the graining phase and significantly extend his first stint on the yellow-walled medium tyre – gaining an 11 lap advantage against Verstappen as shown above.

He didn’t lose time in the pitlane by staying out during the first VSC period either, as a second VSC, caused by a mechanical retirement for Mick Schumacher, neutralised Verstappen’s earlier advantage.

This also gave Sainz licence to extend his stint and shorten any subsequent stints on different tyres. It afforded Sainz the tyre offset advantage at a cost of about six seconds compared with Verstappen’s first 20 laps, with 50 laps remaining in the race. It looked like advantage Ferrari at this stage.


Chart 3: Lap Times Compared,  Sainz vs Verstappen

Canada data graph smoothed lap times

The solid lines above show the laptime trends of both Verstappen and Sainz, minimising anomalies caused by traffic and errors. The middle part of Chart 3 highlights how the tyre offset gave Sainz the opportunity to push harder on his tyres relative to Verstappen and therefore extract more pace.

After lap 30, Sainz’s lap times begin to get more volatile, while Verstappen is able to find a narrow range in performance. Despite this, Sainz’s trend pace is still better than that of Verstappen’s but not good enough to put a meaningful dent in that six-second gap as shown in Chart 1 – with little change in the relative position between both drivers.

Related article

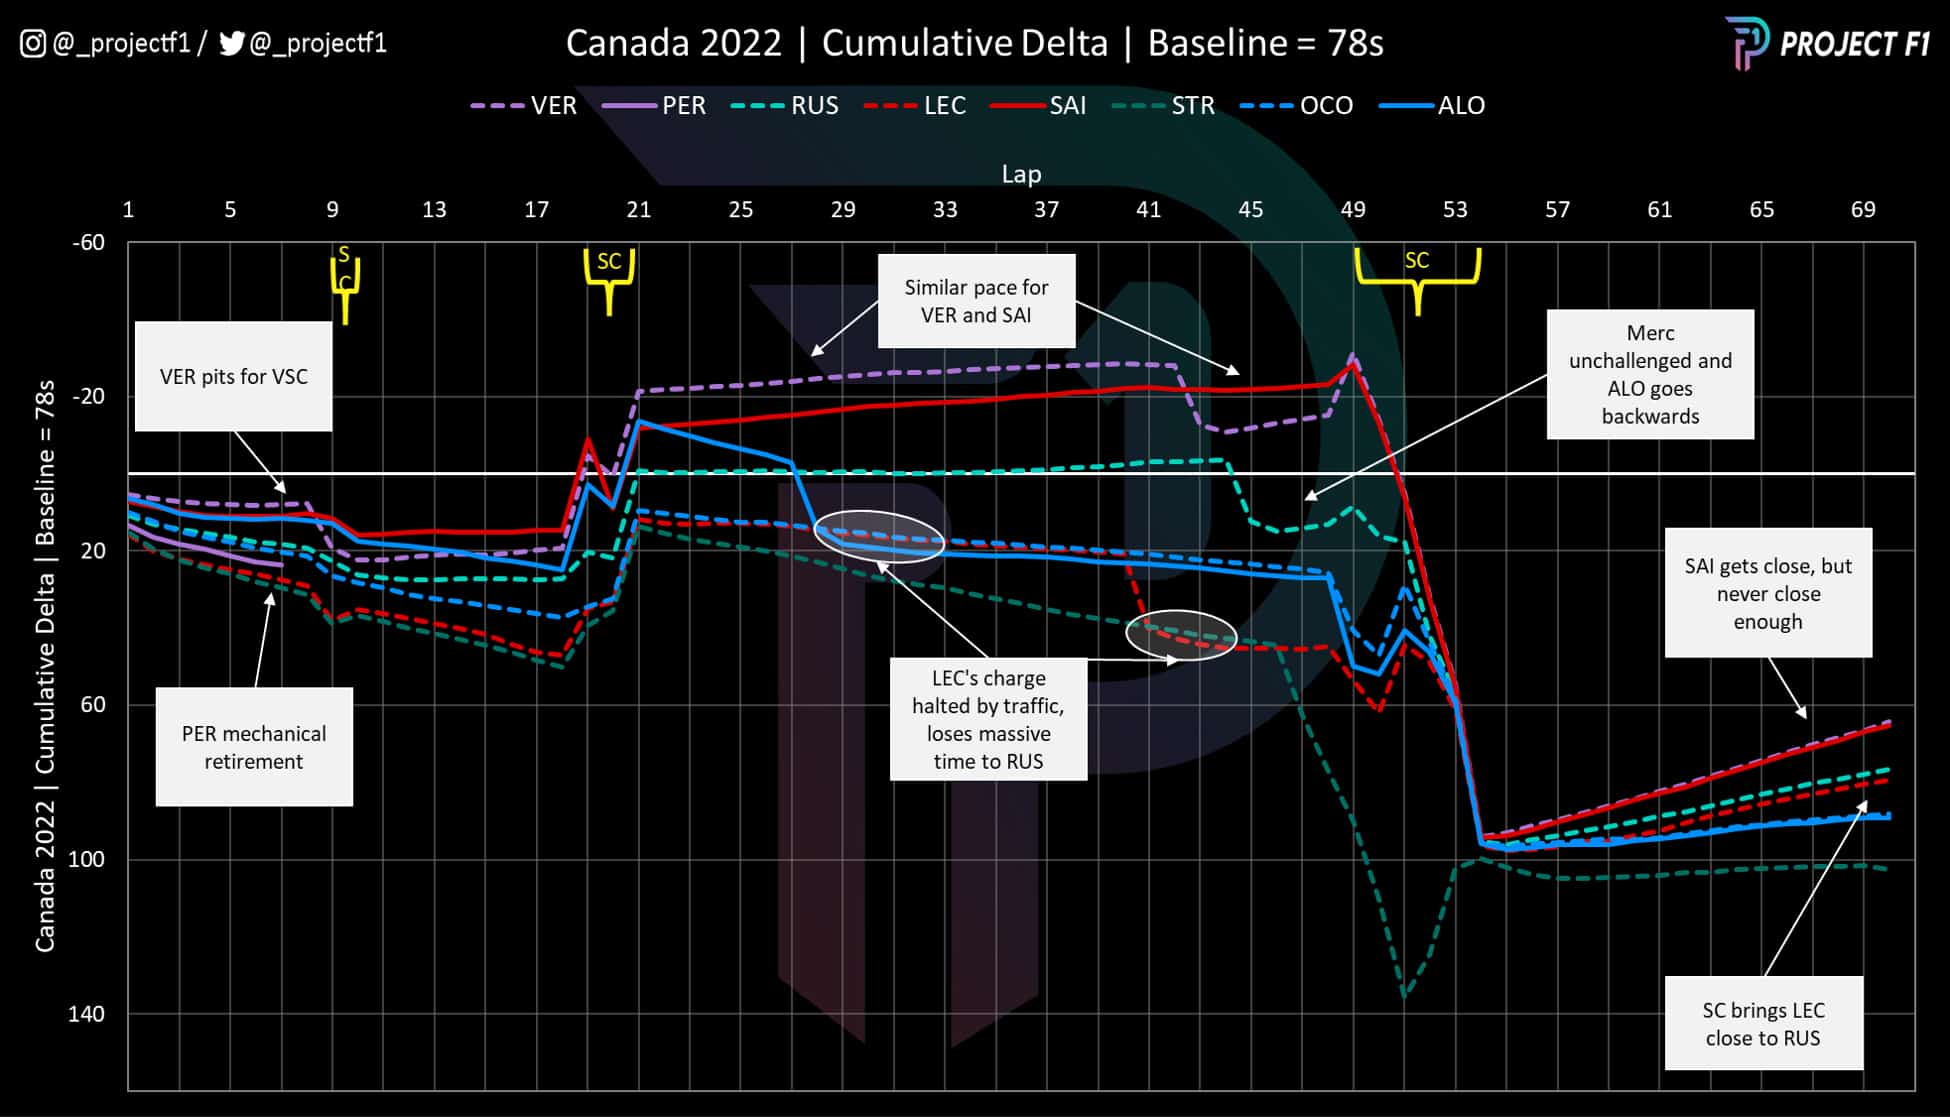
Verstappen pitted on lap 43 for another set of hard tyres to make the charge back against Sainz. At this point Ferrari had to decide on either the one-stop or two-stop strategy route. One thing pushing against a pitstop was the risk of falling behind George Russell when Sainz returned to the track. The other was the fact that Sainz had tyres that were 11 laps fresher. At the very least this would afford a chance to observe the situation rather than needing to respond immediately.

Sainz upped the pace on laps 47 and 48, limiting the damage from Verstappen’s early push on the new hard tyre to just over half a second a lap. With track position and continued strong pace, Sainz was still on for the win.

But on lap 49 Tsunoda would get carefree and put the car into the wall outside of Turn 2 and trigger a full course safety car. Ferrari had little option but to pit Sainz, given that the field would close up and leave the Spaniard vulnerable to a fresher-tyred Verstappen.

So Sainz pitted with minimal time loss. Although he lost the lead, he remained second and, thanks to the safety car, right underneath Verstappen’s rear wing.

Now it was Sainz with the fresher (by six laps) tyres, with about a third of the Grand Prix to go and still no challenge from team-mate Leclerc who had become bogged down in traffic on two occasions – the first against Ocon when struggling with rear traction and the second against the Stroll train due to a slow pitstop. This was still Sainz’s best opportunity for a win so far.


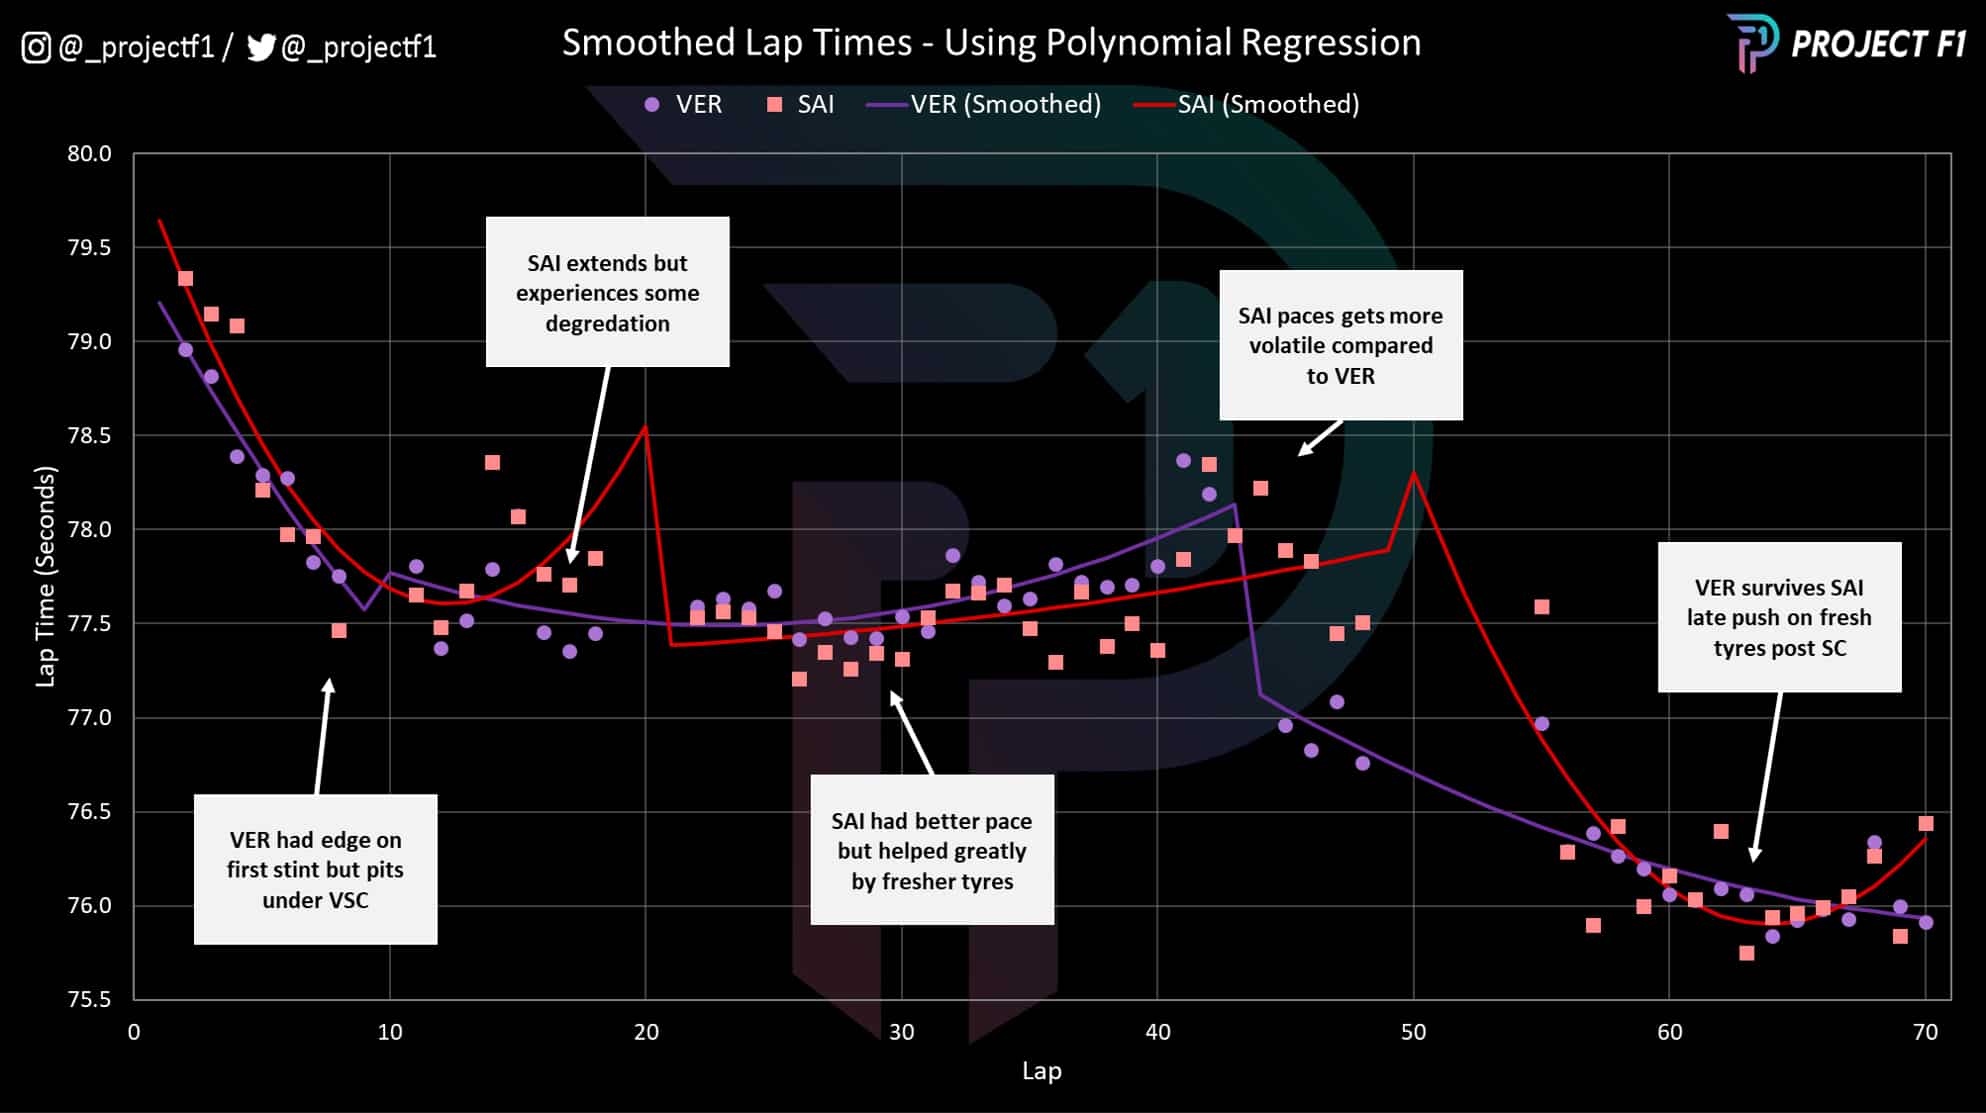
Chart 4: Sector Times Compared, Sainz vs. Verstappen

Canada GP data graph battle for win

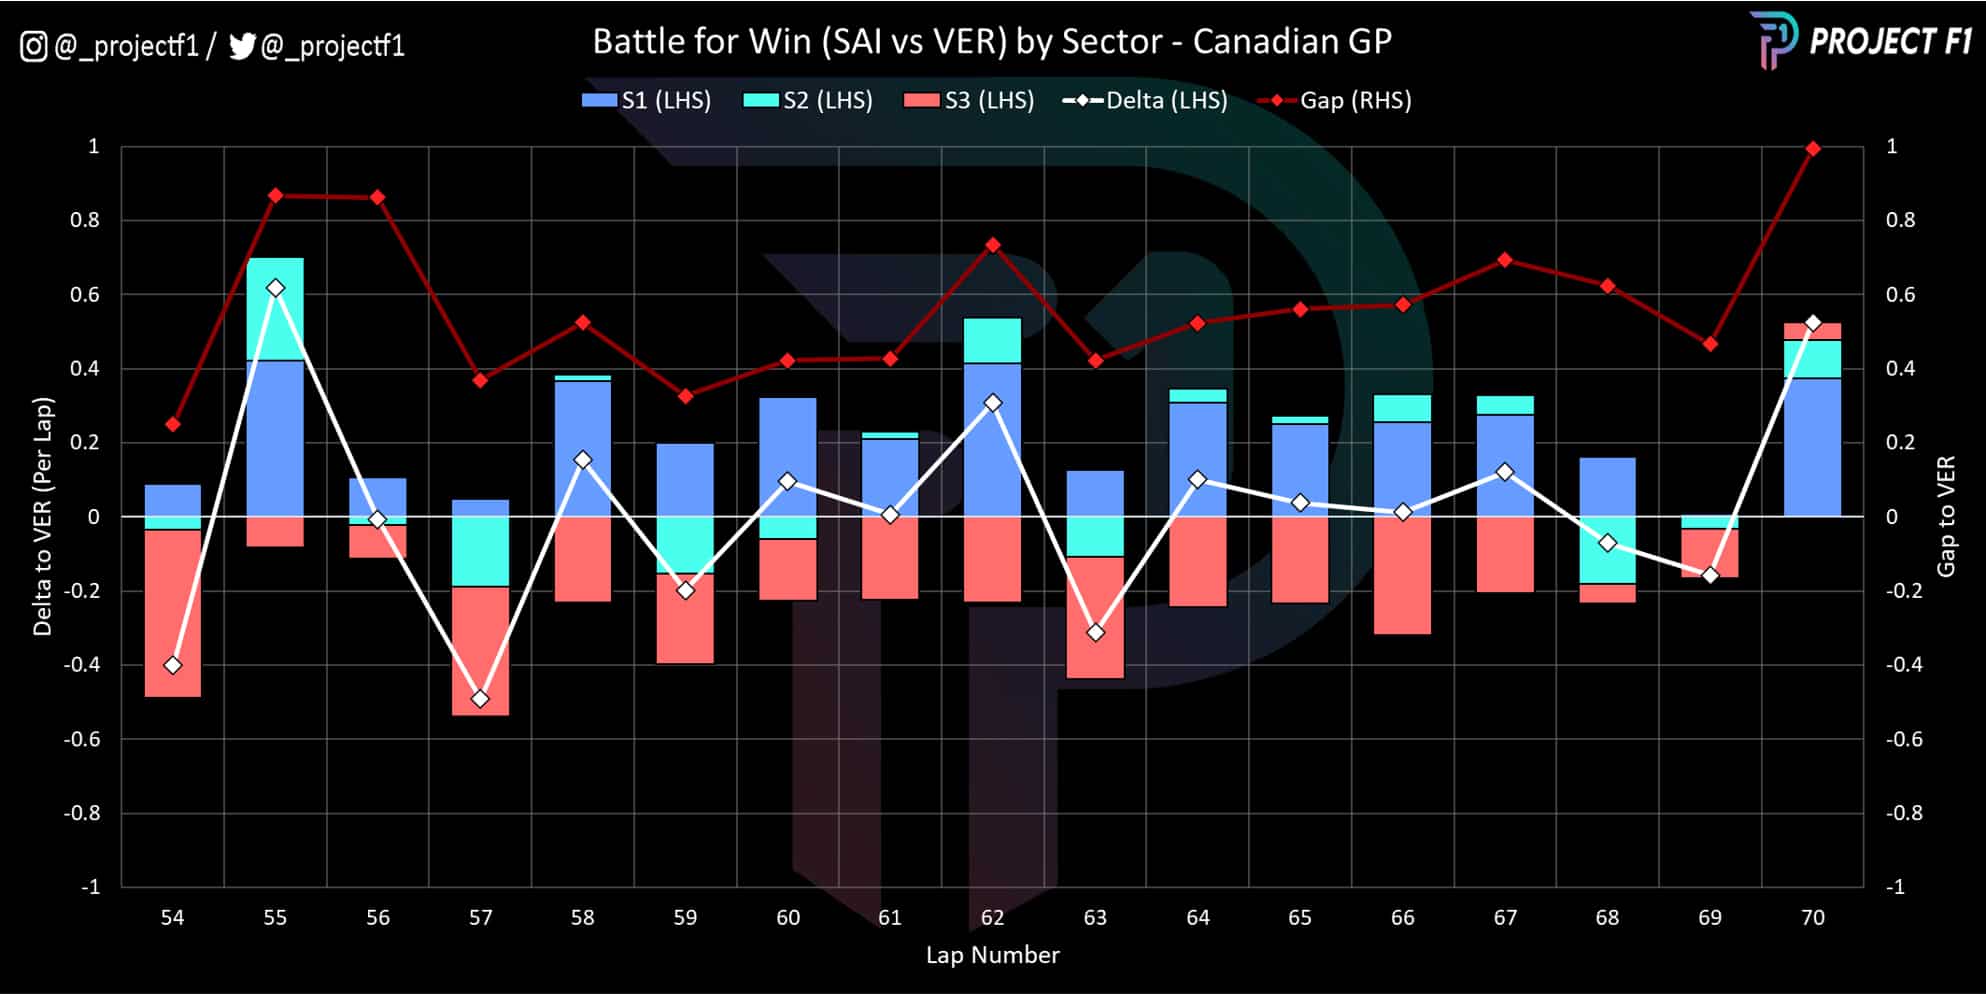
The battle was on and Chart 4 illustrates how it played out, sector by sector for each of the final 16 laps, with Sainz’s lap time delta to Verstappen (the white line) and the overall gap between the cars (red line).

Sainz was rarely more than 0.6sec behind the Red Bull, and within DRS range for most of the stint. This helped him to gain around 0.2sec on Verstappen, largely in the two DRS zones of sector 3. However, Verstappen was able to claw the majority of this back through sector 1, with the performance in sector 2 flip-flopping about.

If he was going to win, Sainz needed to do more and gain enough over a lap to be a meaningful threat to Verstappen on any series of consecutive laps. As it was, he was never closer than on lap 54 — after which Verstappen immediately responded.


Chart 5: Race Pace Distributions

Canada GP data graph lap time distribution Canada GP graph lap time distribution on hard tyres

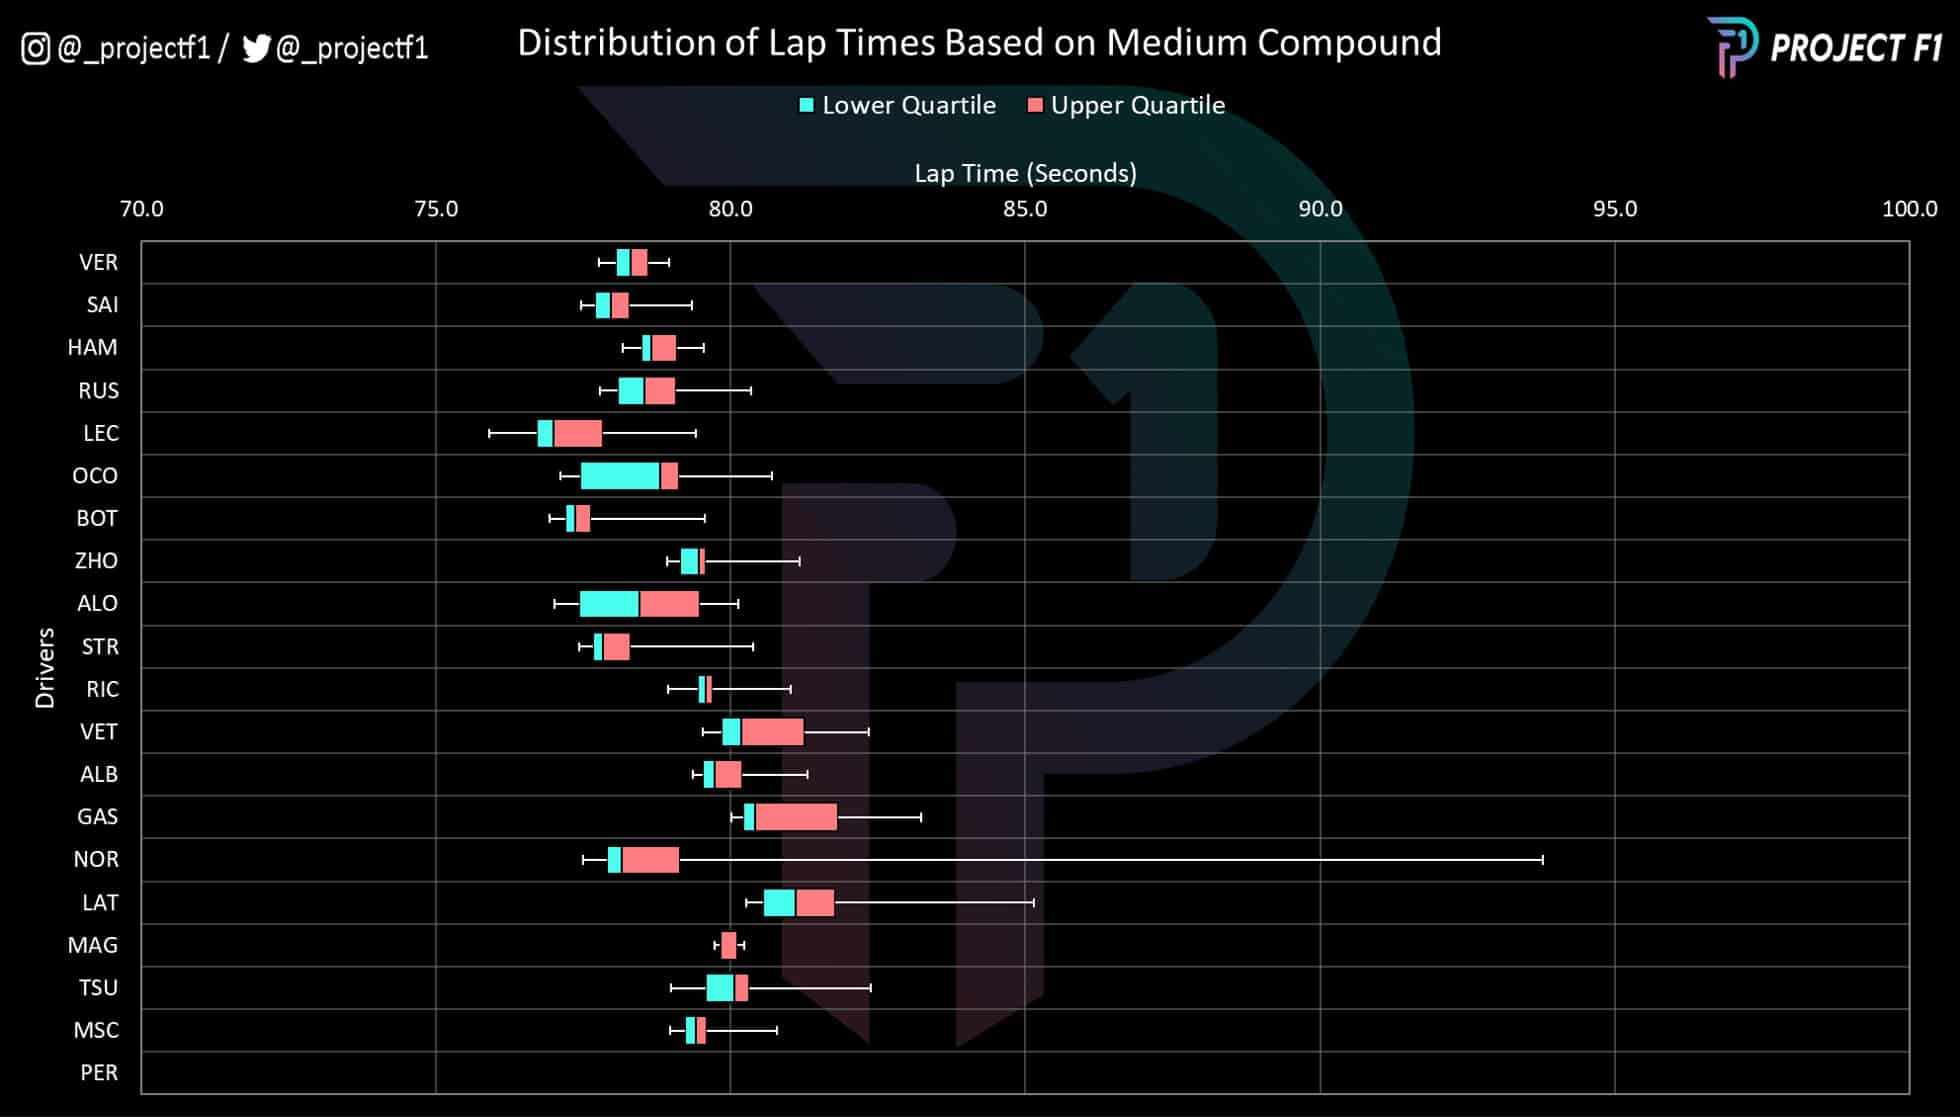
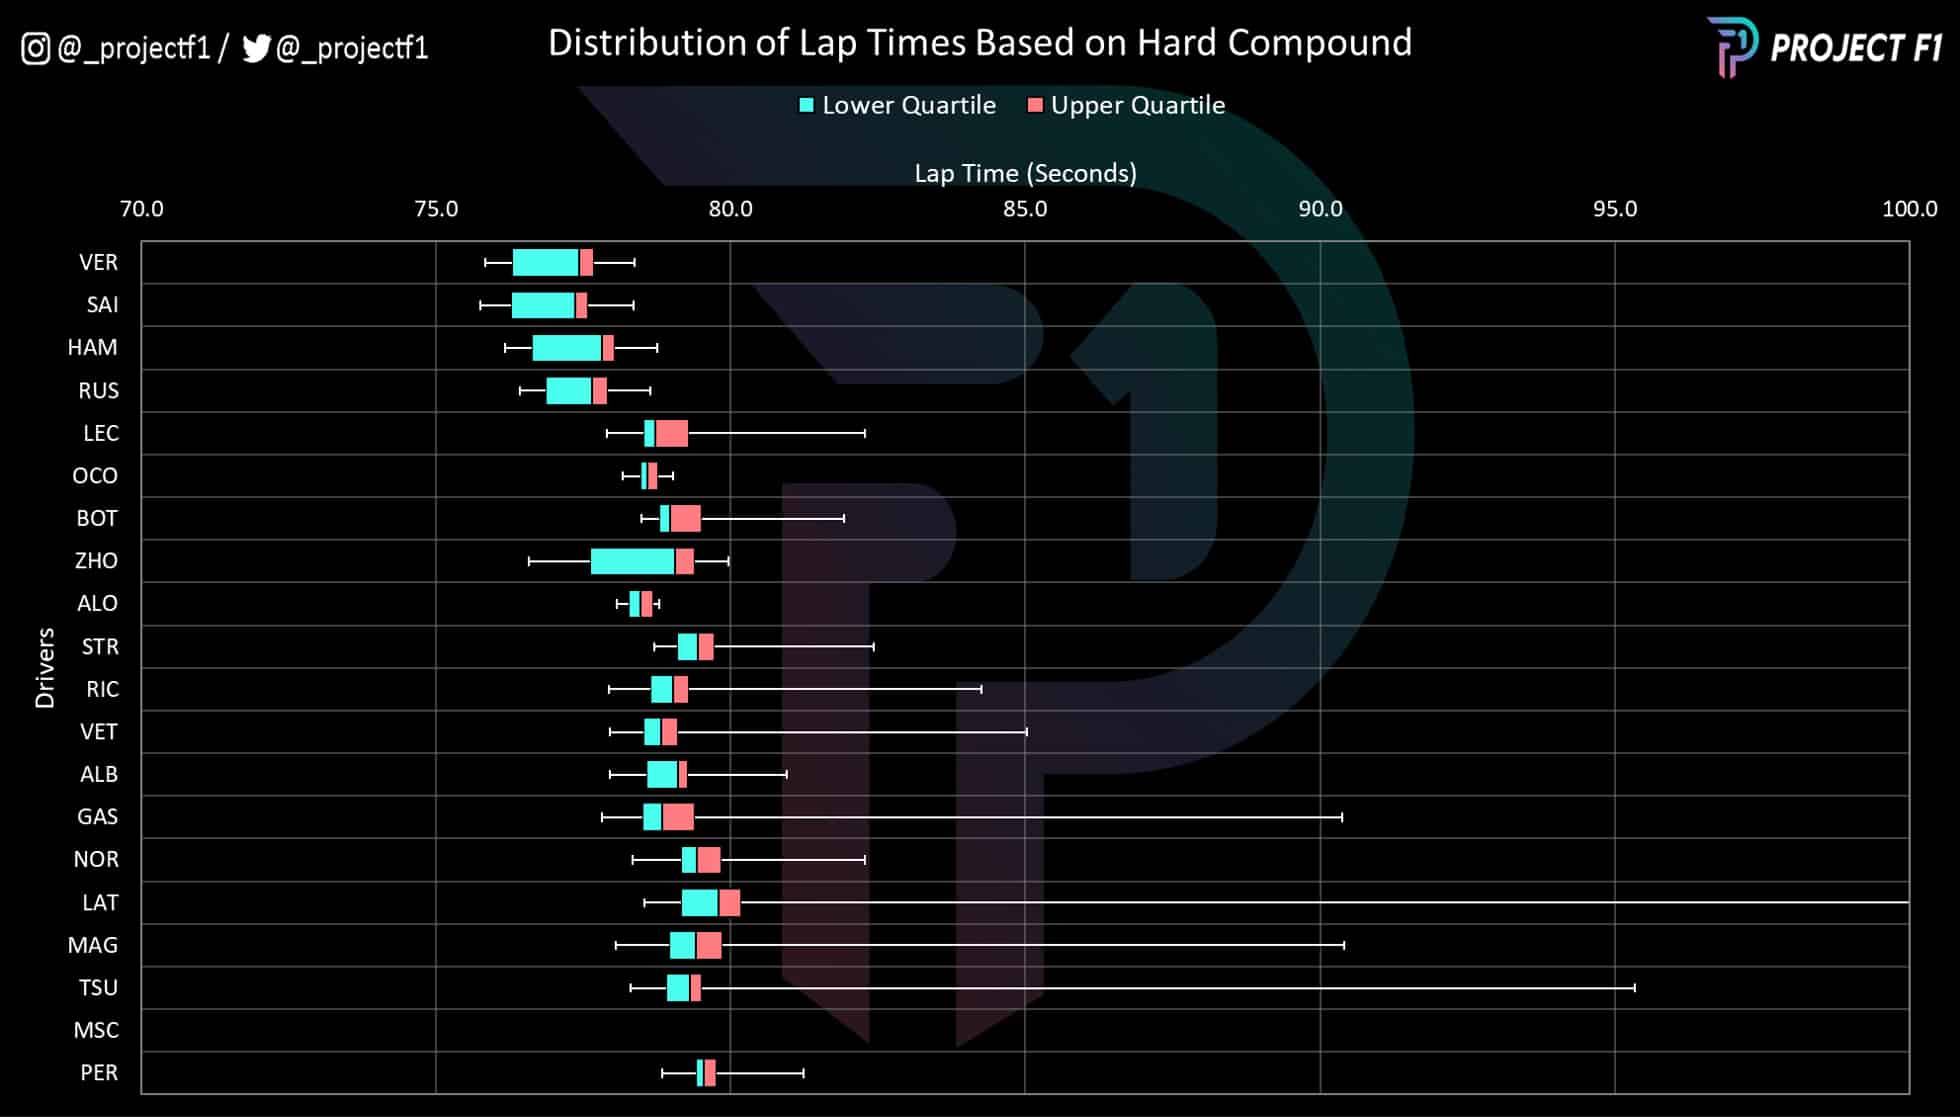
Looking at the data alone, Sainz had better race pace on both the medium and hard compound tyre, as shown in the graphs above which plot the range of lap times recorded on each tyre (the white line), as well as the lower and upper quartiles, representing the mid-range lap times.

An advantage for Sainz has not been a common trend for the 2022 season so far and is a step in the right direction for the Spaniard, but bear in mind that this chart misses the crucial context of the safety cars and how the hard tyre performance is significantly influenced by his shorter stint duration.

So despite having the better pace and better fortune through safety cars, Sainz was still not able to topple Verstappen and take the maiden win that he arguably should have been able to.

However, don’t underestimate the challenge of fighting the world champion: Verstappen delivered a faultless weekend and overcame all challenges to take another win for his 2022 campaign.


Project F1 turns data into graphics that uncover race pace and strategy
See more analysis at @_ProjectF1 on Twitter or @_ProjectF1 on Instagram