Where did Aston Martin's pace come from in the 2023 Bahrain Grand Prix? Project F1 examines the data to uncover the advantage it held over Ferrari and Mercedes — and why Red Bull was on another planet
It began perhaps more in hope than expectation, with whispers that Aston Martin was looking strong after its car launch.
But as practice followed testing and anticipation became hype, the growing grin on Fernando Alonso‘s face gave away the sensational leap that the Silverstone-based team had made over winter.
F1 fans have seen plenty of false dawns before, so couldn’t be blamed for doubting the advance of Aston Martin, but having outraced Ferrari and Mercedes cars, Alonso’s podium result in Bahrain was the proof that the team had broken the stranglehold of the top three teams. Or was it?
We’ve looked into the data to understand exactly why Alonso was so fast compared to Ferrari and Mercedes: this is the graphical story of the Bahrain Grand Prix.
Sakhir tough on tyres
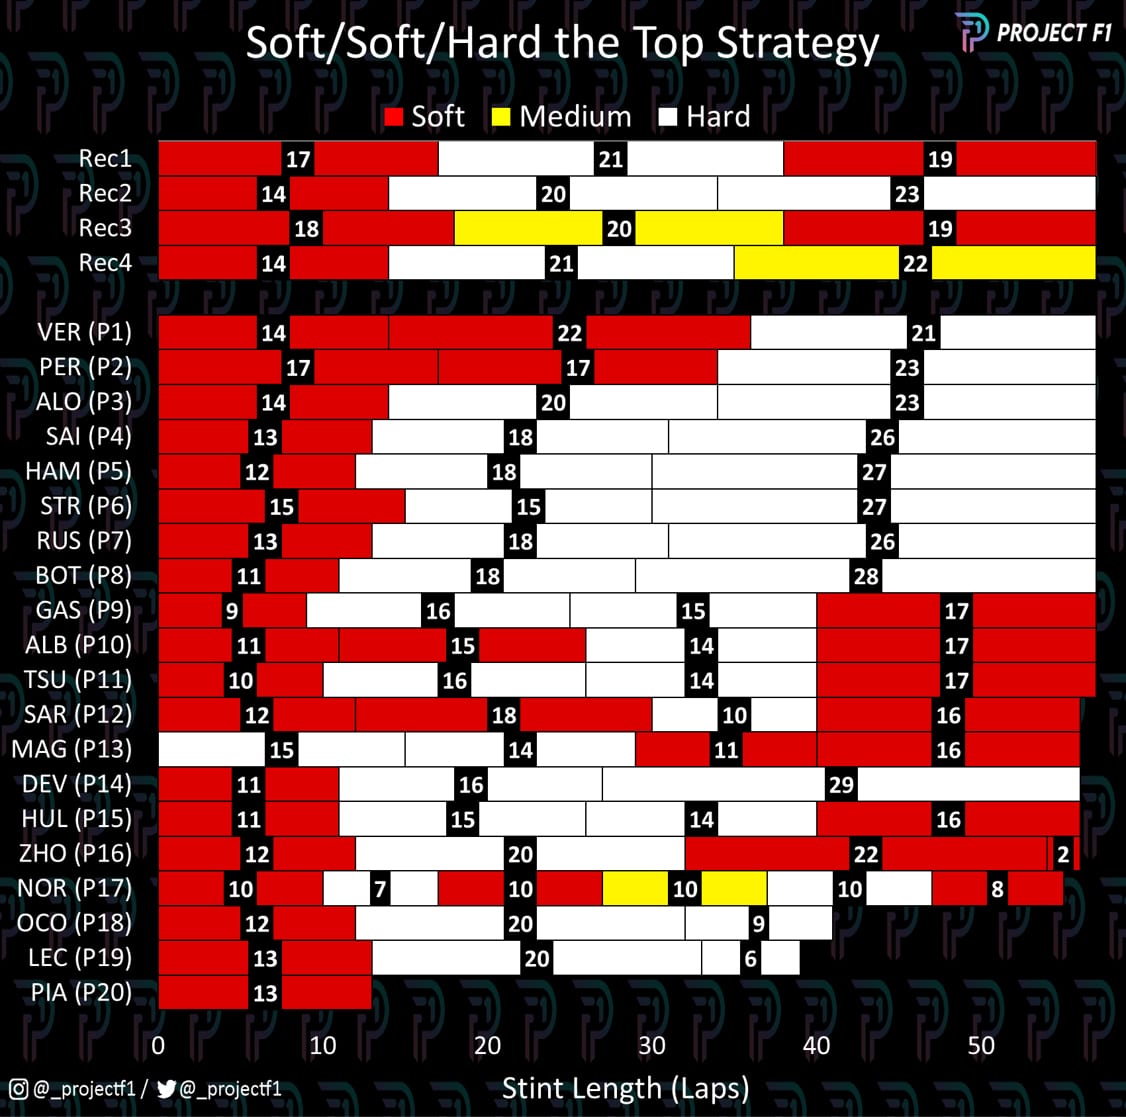
Chart 1 Summary of Recommended and Deployed Strategies
Chart 1 summarises the strategies used by each driver, underneath the four options recommended by tyre manufacturer Pirelli. The highly abrasive surface of the Bahrain International Circuit is a challenge for tyre preservation and often results in a multiple-stop race.
This year was no different, despite the new 2023 construction, and most of the grid followed Pirelli’s suggested strategy. Even so, many struggled to stretch the first two stints to the suggested durations.
With the benefit of fuel burn and management, it would be easier to go the distance in the final stint. However the podium sitters were not as challenged by this: both the Red Bull drivers hit their desired first stint length, while Alonso followed the second strategy to a tee.
The gap to Red Bull
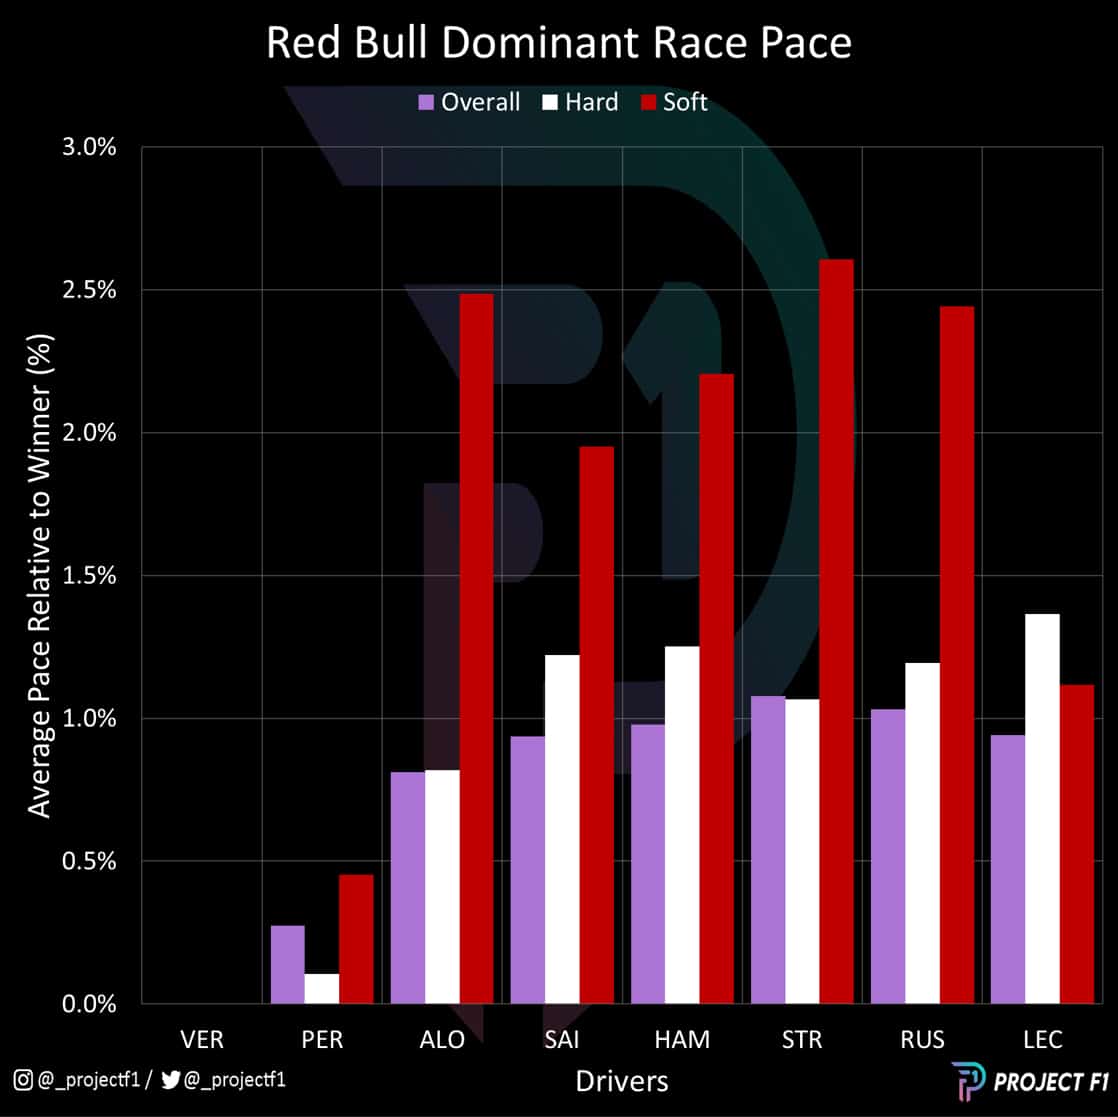
Chart 2 Race Pace vs Race Leader
Red Bull’s dominance of the race was largely predicated on its superior performance using the soft compound tyre, displayed spectacularly above.
Chart 2 highlights the massive discrepancy that most in the top 10 had compared to Max Verstappen. Only his team-mate, Sergio Perez, was within a 1% margin on the same tyre. It was a similar story on the hard compound, although Red Bull dominated to a lesser extent.
Ferrari can take some comfort that the next-best competitor for half the race was Charles Leclerc, coming closest (but still significantly off) the Red Bull soft-tyre pace. The gap was greater during the hard tyre stint and before Leclerc could do anything about it, he suffered an electronics issue that put him out of the race. This handed third place to Sainz, who was struggling to lap at the same pace as his team-mate.
Sainz slips away
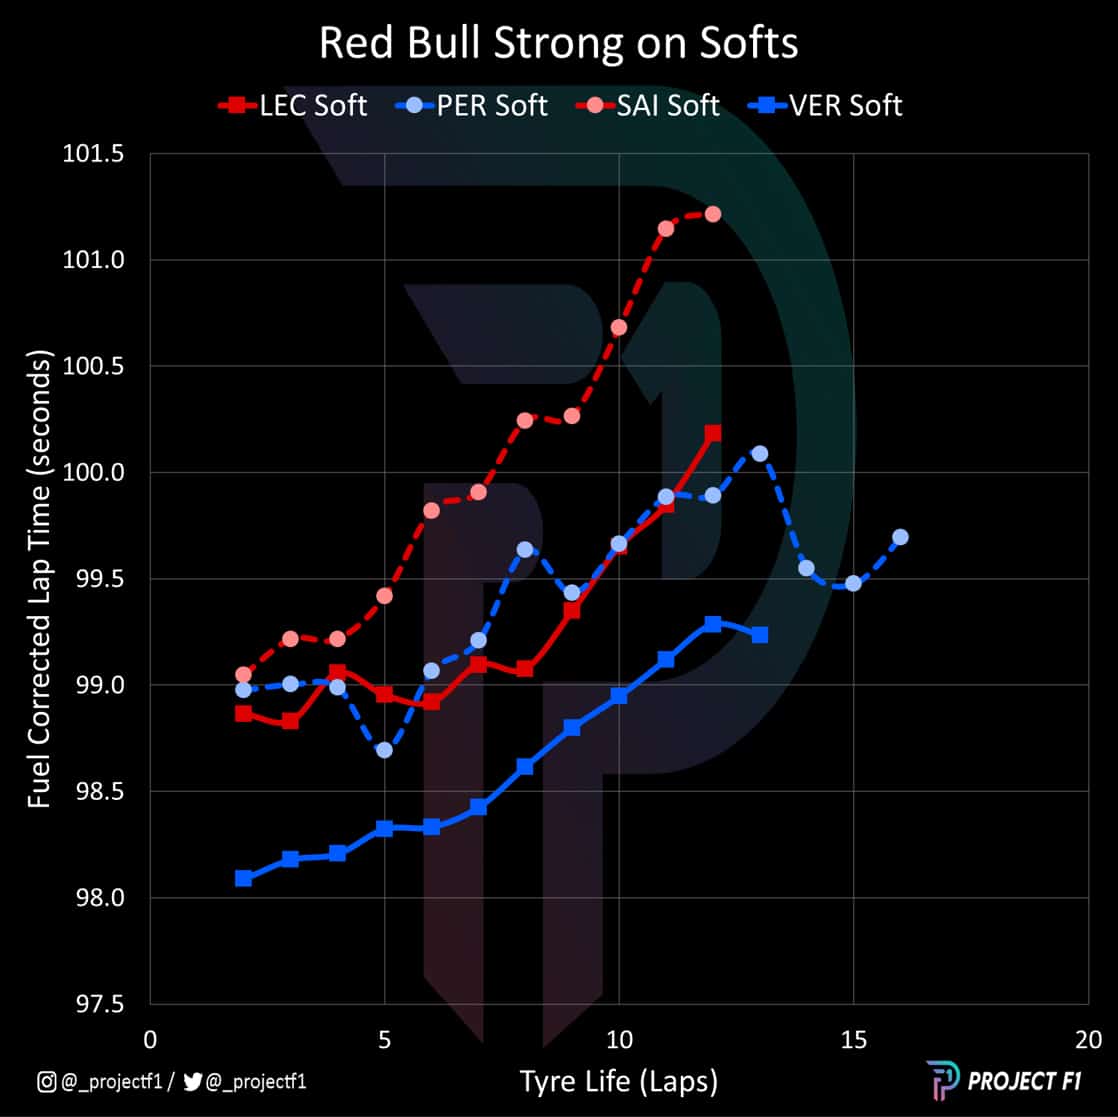
Chart 3 Soft Tyre Degradation – Ferrari vs Red Bull
Chart 3 shows the effect of tyre degradation on the Red Bulls and Ferraris, corrected for the improvement in lap times due to a reducing fuel load.
Verstappen’s lap times were in a league of their own, followed by a tight contest between Leclerc and Perez. The Mexican’s pace improves in the later stages of the stint, which is down to inheriting cleaner air and going for a few push laps.
Sainz however was greatly detached from the rest of the group. From the start his pace was uncompetitive, and severe degradation only made the situation worse as the stint carried on. This was also a large reason as to why Ferrari didn’t consider putting Leclerc, let alone Sainz, on the soft tyre for the second stint. It had already lost significant ground to Red Bull and needed to try something different to remain in contention.
But the hard tyre wasn’t that kind to Ferrari either, as Alonso would expose.
Red Bull treats its tyres well
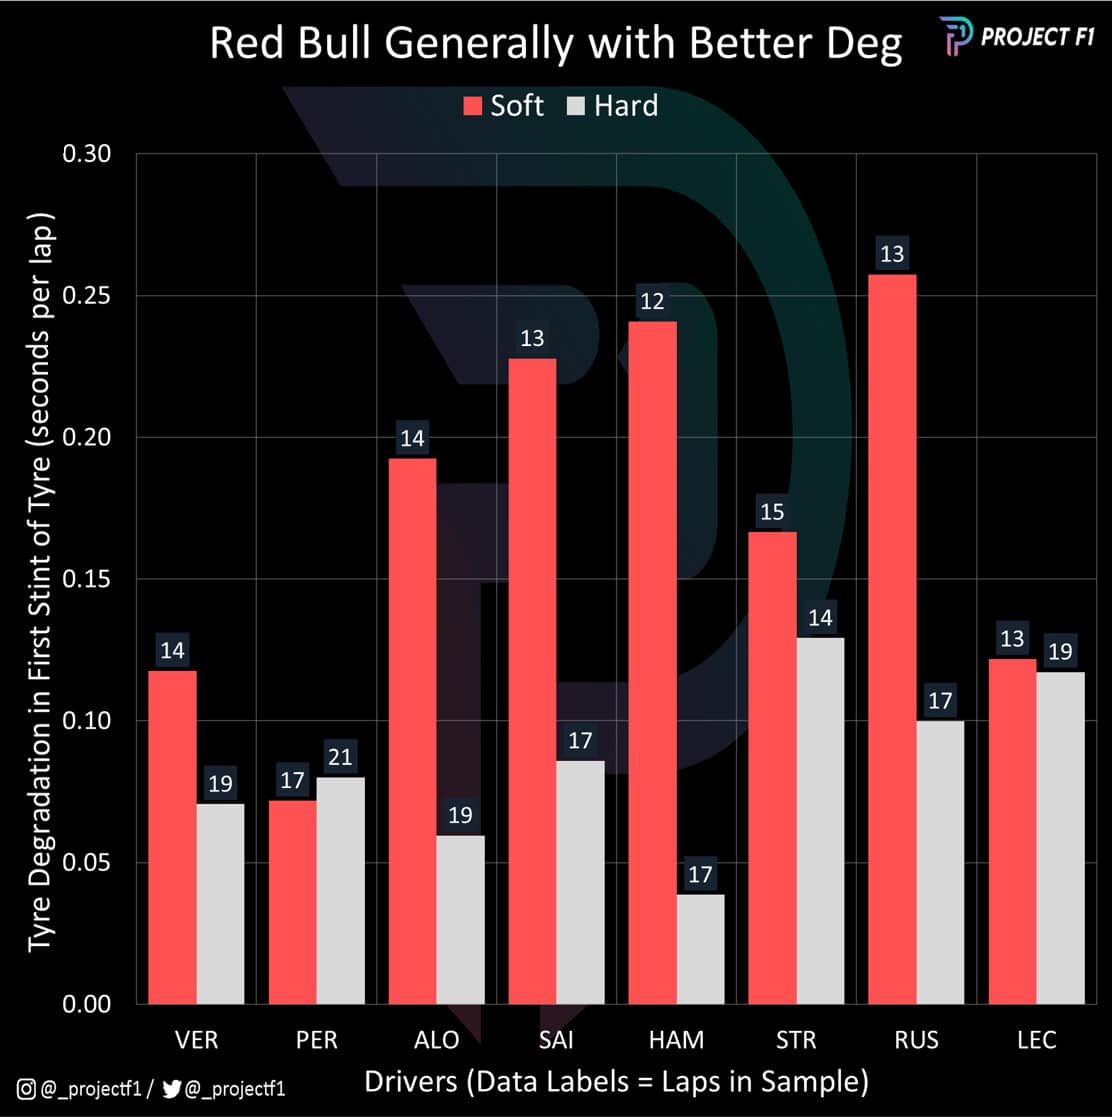
Chart 4 First Stint Tyre Degradation
Chart 4 explores the average time lost per lap to tyre degradation across both the first set of soft and hard tyres used by each driver. As we have already seen, Red Bull performs strongly. We also know that Leclerc was the next best on the softs, but his performance on the hards is among the worst, also impacted by his DNF.
The next-best performance comes from Lance Stroll in the Aston Martin on the soft tyre and Lewis Hamilton on the hard tyre closely followed by Alonso. Here, we need to look beyond the data to understand that Alonso’s stint was two laps longer than Hamilton’s and more impacted by running in dirty air.
Considering Stroll’s injuries as well, both Aston Martin drivers put in a solid showing with regard to both pace and tyre management – especially compared to the likes of Ferrari and Mercedes.
Bahrain GP at-a-glance
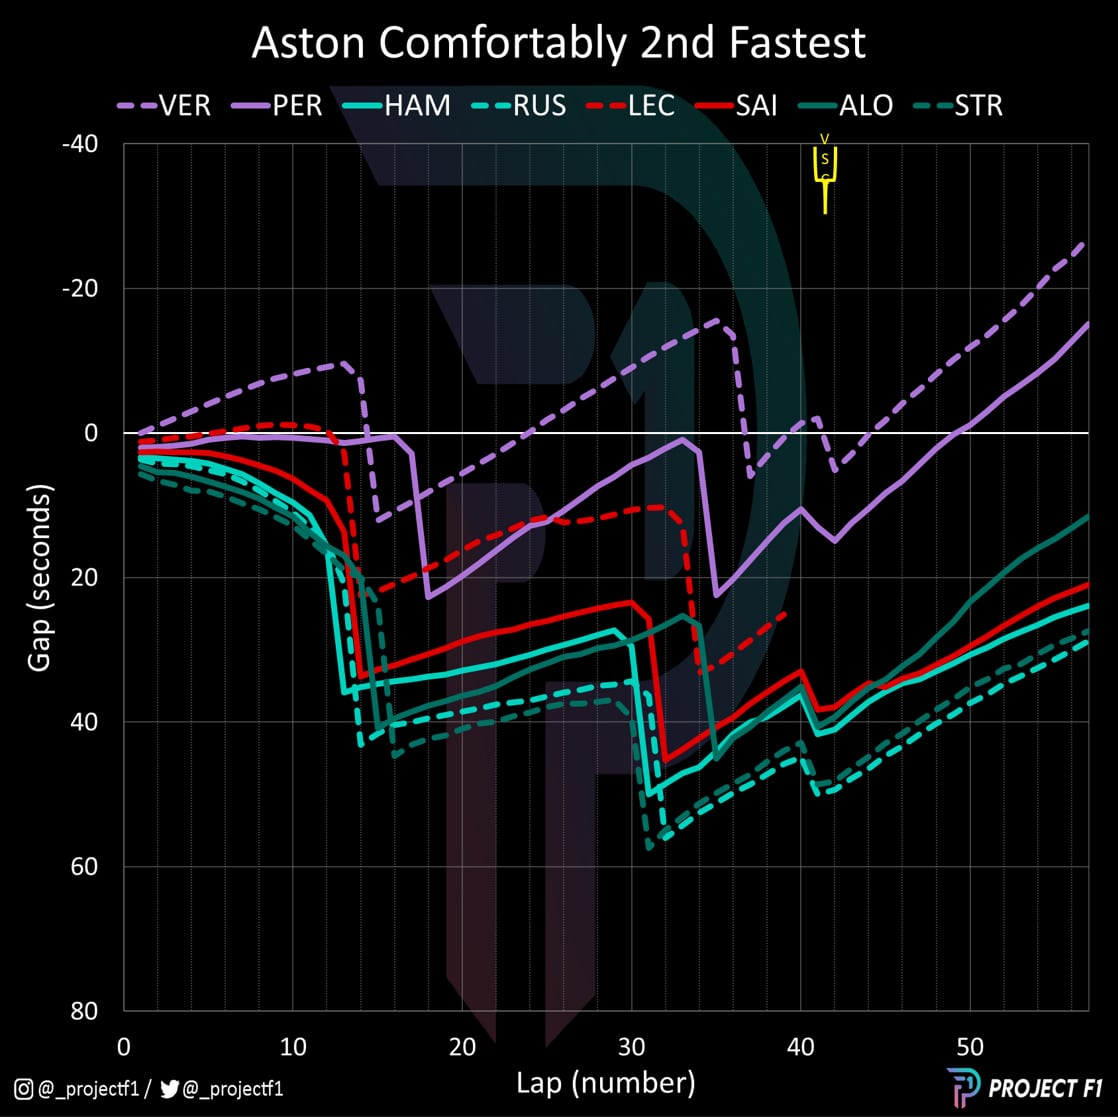
Chart 5 Race Summary – Cumulative Delta
Putting all of this together and we arrive at the whole race view as summarised in Chart 5 above. The cumulative delta chart shows each driver’s average lap time, updated each lap as the race goes on, and set against an average time.
The previous insights provide the context to understand why Verstappen and Perez ran away from the rest of the field as the gap to their rivals grew.
“Today we were fighting for big things” said Fernando Alonso. But that didn’t include victory in the 2023 Bahrain Grand Prix. The ominous gap to Max Verstappen suggests Red Bull is set to dominate F1 — for now
By
Chris Medland
It also explains why Leclerc’s race was a tale of two halves: his performance on the softs was enough to keep Perez at bay but that couldn’t be replicated on the hard tyre.
But what is most fascinating is seeing the contrasting experience of Alonso, who was hampered in the first stint behind the Mercedes and on soft tyres, but was able to flip his fortunes in the remainder of the race. In fact, not only was he able to turn the tide of the race, but he was able to carve his way through the field.
Alonso was sharply closing the gap to Hamilton and Sainz during his second stint, then left both drivers in his dust during the third.
The tyre performance in the final stint was night and day different, as Alonso galloped ahead. He then eased off to conserve the car and his third place. Ferrari and Mercedes were clinging onto what little they had left. Sainz and Hamilton even almost fell into the clutches of Stroll who had already made work of George Russell, despite his recent wrist surgery.
Sainz was lucky not to lose fourth to Hamilton who was performing better in the initial stages of the final stint, only to fall away in the final stages of the race.
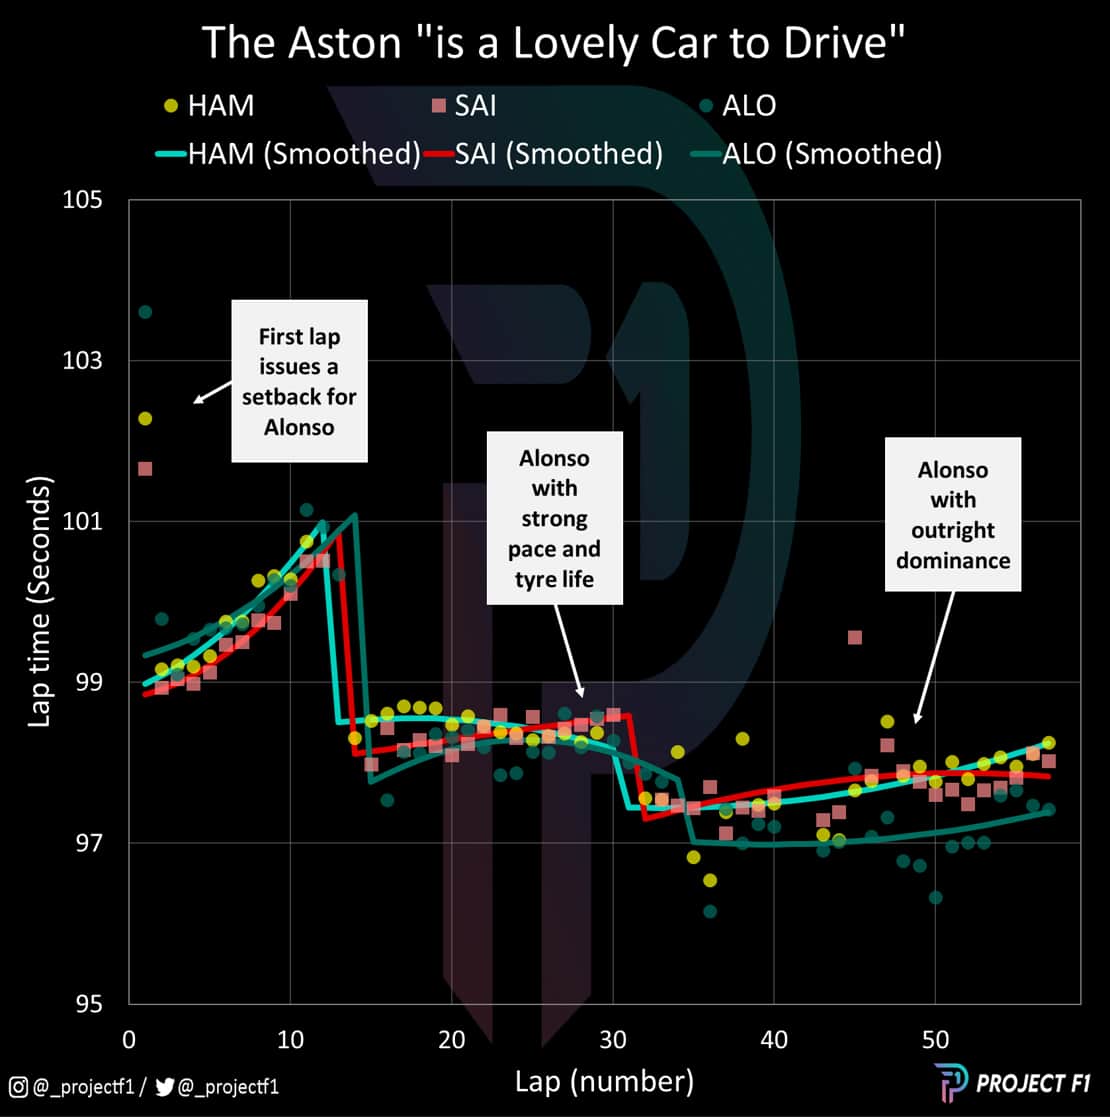
A lovely car to drive
Chart 6 Trend Pace Comparison
A look at the trend race pace across the Grand Prix, which smooths out anomalies, makes the strong case for Aston Martin being the second-best car. Outside of a poor start and tussle on the opening lap which hampered the performance on the first stint, Alonso had the edge in the pace battle with Ferrari and Mercedes.
Alonso was dominant with the hard tyre: his pace in the final stint moving up to another level despite the aggressive use of the tyre in a few overtaking manoeuvres. The extra longevity on the second stint was also impressive with Mercedes pitting pre-emptively for fear of the undercut from Alonso. But in the end, it didn’t matter as the Spaniard was simply too fast.
Mercedes had some potential against Ferrari but hit a plateau and tailed off by the final 10 laps of the race. Both teams have massive room to improve if they are to defend their mantle toward the front of the grid.